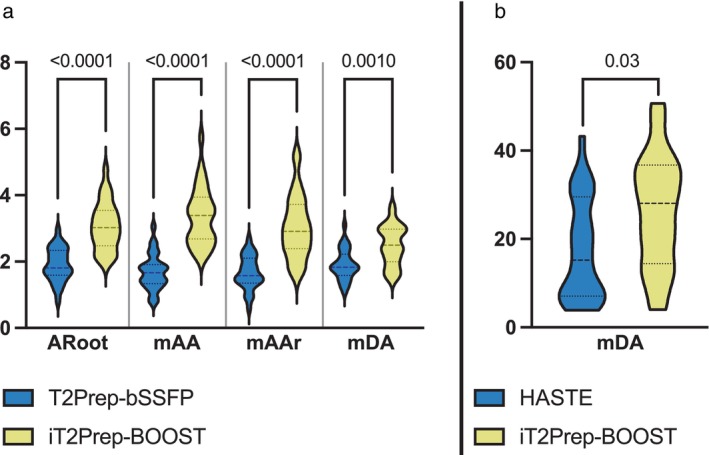
FIGURE 6.

(a) Contrast ratio (CR) between blood‐pool at the mid descending aorta (mDA), mid aortic arch (mAAr), mid ascending aorta (mAA) and aortic root (Aroot) levels and myocardium for the proposed iT2Prep‐BOOST (in yellow) in comparison to the clinical T2Prep‐bSSFP (in blue) bright‐blood images. (b) CR between vessel wall and blood pool at the mDA level for the proposed iT2Prep‐BOOST (in yellow) in comparison to clinical HASTE (in blue) black blood images. The proposed iT2Prep‐BOOST method results in significantly higher CR compared to the conventional approaches for both bright and black blood images, with P values as indicated in the figure.
