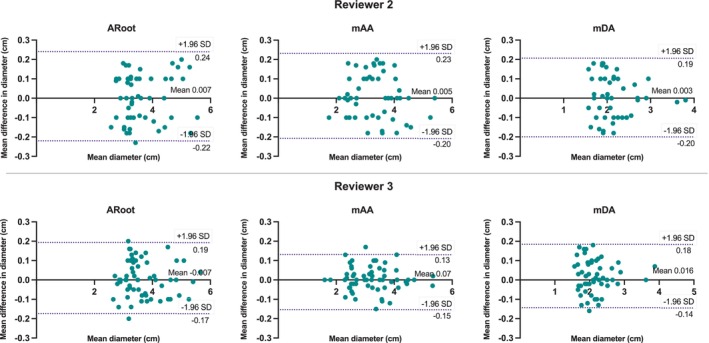
FIGURE 7.

Bland–Altman analysis for co‐axial diameter measurements at the aortic root (ARoot), mid ascending aorta (mAA), and mid descending aorta (mDA), comparing the iT2Prep‐BOOST and T2prep‐bSSFP bright‐blood images for reviewer 2 (top row) and reviewer 3 (bottom row). In each plot, the solid black line indicates the mean bias of the diameter measurements, whereas the dotted lines represent the 95% confidence interval. Values are given in centimeter.
