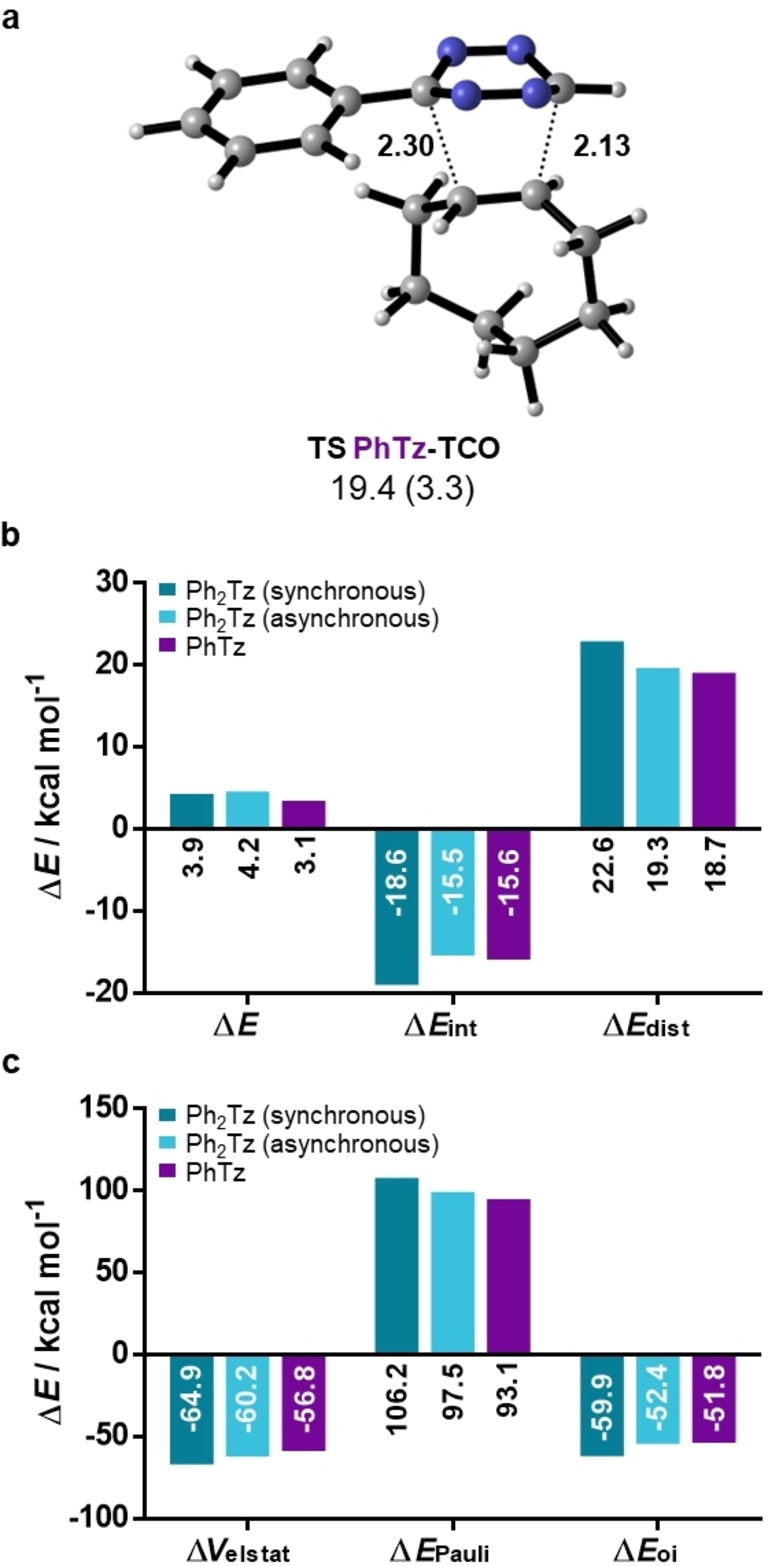
Figure 4.

a) Transition state geometries and activation energies for the reaction of TCO with PhTz; distances are given in Å. Gibbs free energies of activation and electronic energies of activation (in parenthesis) are shown in kcal mol−1; b) Distortion/interaction and c) energy decomposition analyses.
