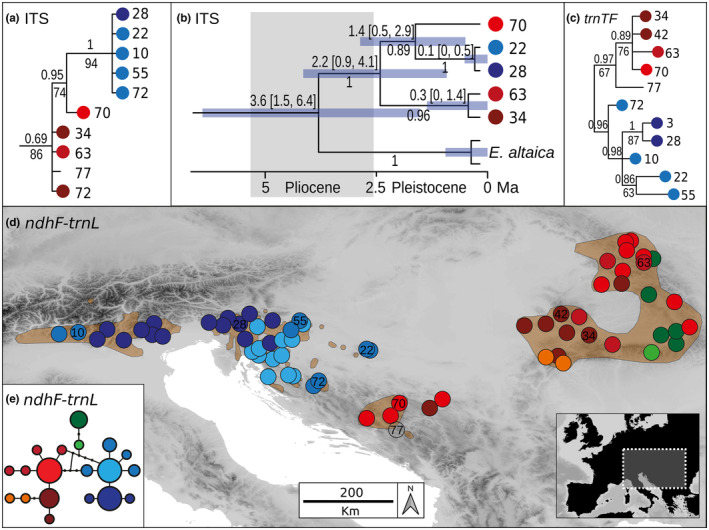
FIGURE 1.

Internal transcribed spacer (ITS) and plastid DNA (ndhF–trnL and trnT–trnF) variation in Euphorbia carniolica. Population numbers correspond to Data S1. (a) Bayesian consensus phylogram inferred from ITS sequences of E. carniolica. Numbers above branches are posterior probabilities (PP), those below branches maximum parsimony bootstrap values (BS). The complete tree is in Figure S4. (b) Bayesian consensus chronogram (maximum clade credibility tree). Numbers below branches are PP, those above branches the median crown group age in millions of years, and the bars and the numbers in brackets correspond to 95% highest posterior densities (HPD) of the age estimates. The complete tree is in Figure S6. (c) Bayesian consensus phylogram inferred from plastid trnT–trnF sequences of E. carniolica. Numbers above branches are PP, those below branches BS values. The complete tree is in Figure S5. (d) Distribution of ndhF–trnL haplotypes retrieved by the analysis shown in E. Haplotypes not sampled are shown as small black dots. Light brown polygons indicate the species' distribution range according to Meusel et al. (1978) and supplemented with additional, more recent distribution data (Nikolić, 2021; Poldini, 2002). The insert shows the position of the study area in Europe. (e) Statistical parsimony network of ndhF–trnL haplotypes. The size of a circle is relative to the square root of a haplotype's frequency.
