
FIGURE 2.
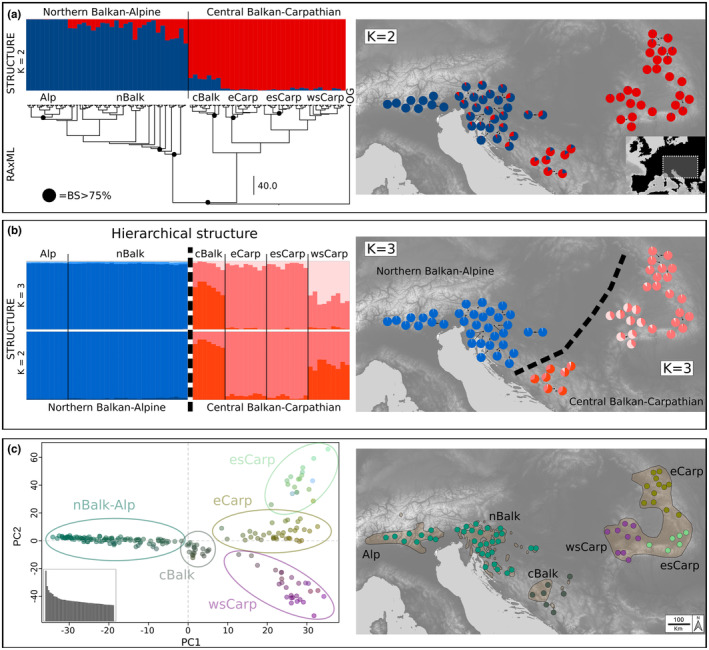
Phylogenetic relationships and genetic variation within Euphorbia carniolica based on restriction site‐associated DNA sequencing. (a) Phylogenetic tree inferred via maximum likelihood. Black circles above nodes highlight bootstrap support (BS) >75%. Barplots above the tree show the proportion of shared genetic variation inferred from Bayesian clustering for K = 2 groups; the same proportions are shown as pie charts in the map at the populations' sampling localities; overlapping pie charts were slightly shifted to aid legibility. (b) Proportion of shared genetic variation within each of the two main clusters shown in (a) inferred via groupwise Bayesian clustering for K = 2 and K = 3 groups. Proportions for K = 3 groups of both clusters are shown as pie charts in the map at the sampling localities. (c) Ordination of genomic variation along principal components (PC1: x‐axis, PC2: y‐axis, PC3: colour‐gradient); the barplot shows eigenvalues of the first 50 principal components. Ellipses in the ordination indicate the groups as in (a) and (b). Populations in the map are colour‐coded based on their group affiliation in the principal component analysis. Group names: Alp, Alpine group; nBalk, Northern Balkan group; cBalk, Central Balkan group; eCarp, Easter Carpathian group; esCarp, Eastern Southern Carpathian group; wsCarp, Western Southern Carpathian group. Light brown polygons indicate the distribution range of E. carniolica according to Meusel et al. (1978) and supplemented with additional, more recent distribution data (Nikolić, 2021; Poldini, 2002).