
FIGURE 5.
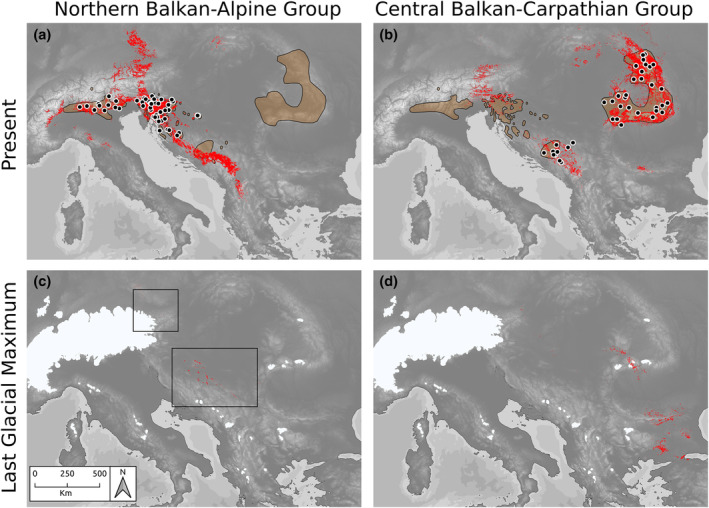
Predicted occurrences (indicated in red) of the two main genetic groups within Euphorbia carniolica inferred via species distribution modelling based on present‐day climatic conditions (a, b) and climatic conditions of the LGM 20 ka (c, d). Polygons represent the extant distribution range of E. carniolica, and symbols indicate populations used for modelling. Enclosing rectangles in (c) intend to enhance visibility of small occurrence patches. White areas in (c) and (d) represent ice cover under LGM conditions (Ehlers et al., 2011).