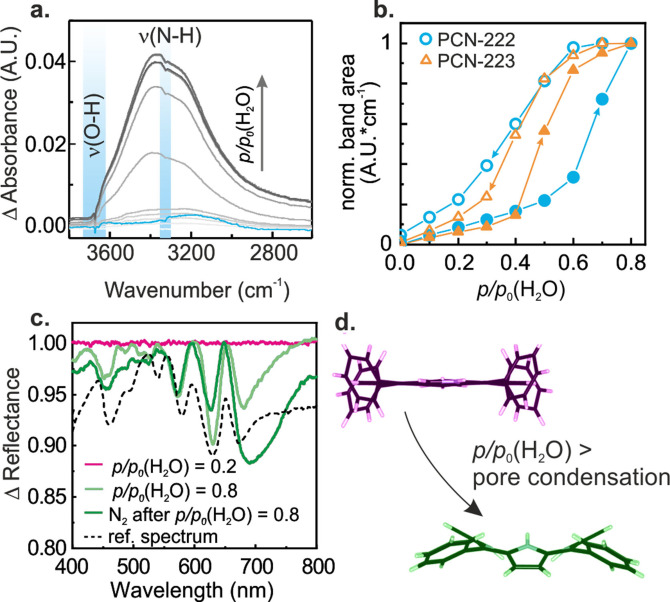
Figure 4.
Water sorption into PCN‐222 and PCN‐223. a. Fourier transform‐infrared (FT‐IR) attenuated total reflection (ATR) spectra of the ν(OH) region recorded with PCN‐223 for p/p 0(H2O)=0–0.8. The blue spectrum was recorded following water adsorption at p/p 0(H2O)=0.8, after 10 min N2 flushing, and shows the irreversible change as ν(O−H) and ν(N−H) negative bands of the Zr−OH groups and porphyrin macrocycle, respectively (highlighted in blue). A band at 3200 cm−1 was assigned to minor amounts of residual adsorbed water. b. Water isotherms were derived from the integral of the ν(O−H) stretching region between 2800–3600 cm−1. Full symbols correspond to the adsorption branch of the isotherm, while empty symbols correspond to the desorption branch. c. Ultraviolet‐visible (UV‐vis) diffuse reflectance spectroscopy (DRS) data during water sorption into PCN‐223 and subsequent N2 flushing. Irreversible changes in the UV‐vis DRS data were only visible if p/p 0(H2O)>pore condensation was applied. For PCN‐222 spectra we refer to Figure S16. d. Schematic of structural changes of the porphyrin linker upon protonation. Less bending is expected for wetting.

