Figure 1.

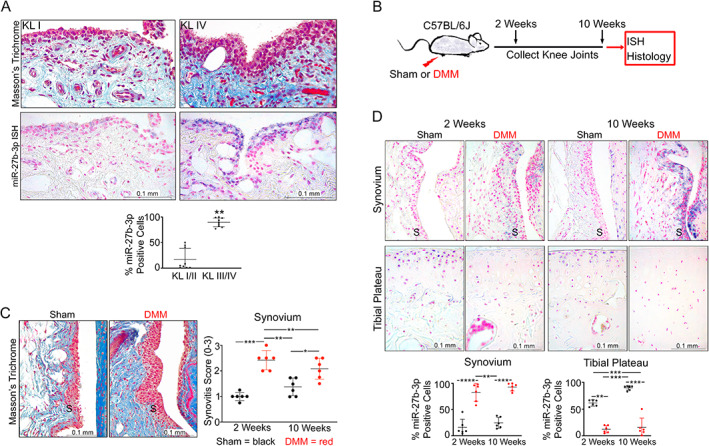
Expression of microRNA‐27b‐3p (miR‐27b‐3p) in samples obtained from human and mouse knee osteoarthritis (OA) synovium. A, Top, Representative images of synovium (original magnification ×40) stained with Masson's trichrome or miR‐27b‐3p in situ hybridization (ISH; purple regions) in samples from radiographic knee OA patients with Kellgren/Lawrence (K/L) radiographic severity grades 1 and 2 or K/L grades 3 and 4. Bottom, Scatter plot showing mean ± SD proportion of miR‐27b‐3p–labeled synovial lining cells in synovium from patients with K/L grade 1 or 2 radiographic knee OA or K/L grade 3 or 4 radiographic knee OA (n = 9/group). B, Destabilization of the medial meniscus (DMM) was conducted on right knees of 10‐ to 12‐week‐old C57BL/6 mice and knee joints were collected at 2 weeks or 10 weeks after surgery. C, Left, Representative images of synovium at 10 weeks after sham or DMM surgery; collagen accumulation in DMM model is shown in blue (Masson's trichrome). Right, Scatter plot showing mean ± SD synovitis severity scores of mouse synovium 2 weeks or 10 weeks after sham or DMM surgery (n = 6/group). D, Top, ISH images of the synovium (S) or tibial plateau (original magnification ×40) (miR‐27b‐3p indicated in purple, nuclei indicated in pink [nuclear fast red]). Bottom, Scatter plots of mean ± SD percentage of miR‐27b‐3p–labeled cells in the synovium or tibial chondrocytes at 2 weeks and 10 weeks after surgery. Relative data were log‐transformed before analyses using Student's unpaired t‐test (A), Kruskal‐Wallis test followed by 2‐stage linear step‐up procedure of Benjamini, Krieger, and Yekutieli (C), or 2‐way analysis of variance with Tukey's post hoc test (D). * = P/q < 0.05; ** = P/q < 0.01; *** = P/q < 0.001; **** = P < 0.0001.
