FIGURE 5.

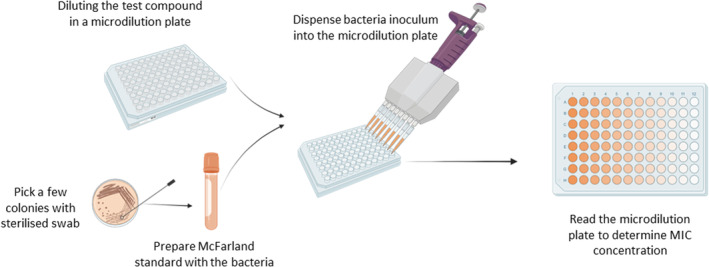
Schematic representation of the broth dilution assay in order to obtain the Minimum Inhibitory Concentration (MIC), created with Biorender.com.

Schematic representation of the broth dilution assay in order to obtain the Minimum Inhibitory Concentration (MIC), created with Biorender.com.