FIGURE 3.

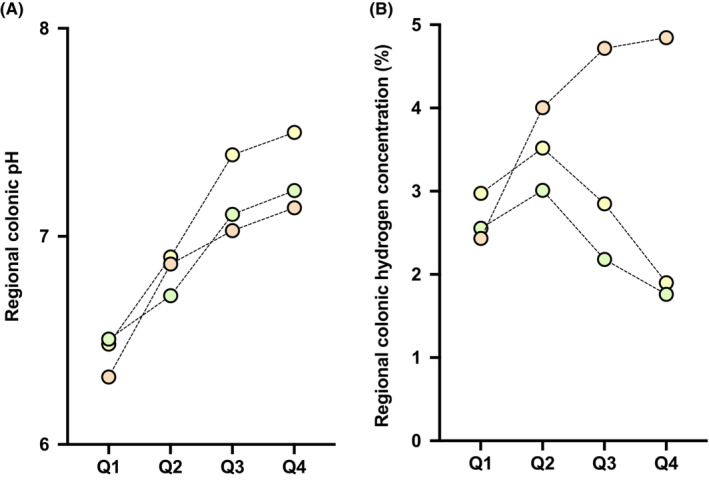
(A) Luminal pH and (B) hydrogen profiles per quartile of relative colonic transit time. Mean pH or hydrogen concentration (% of gas detected within the lumen;) per quartile shown.

(A) Luminal pH and (B) hydrogen profiles per quartile of relative colonic transit time. Mean pH or hydrogen concentration (% of gas detected within the lumen;) per quartile shown.