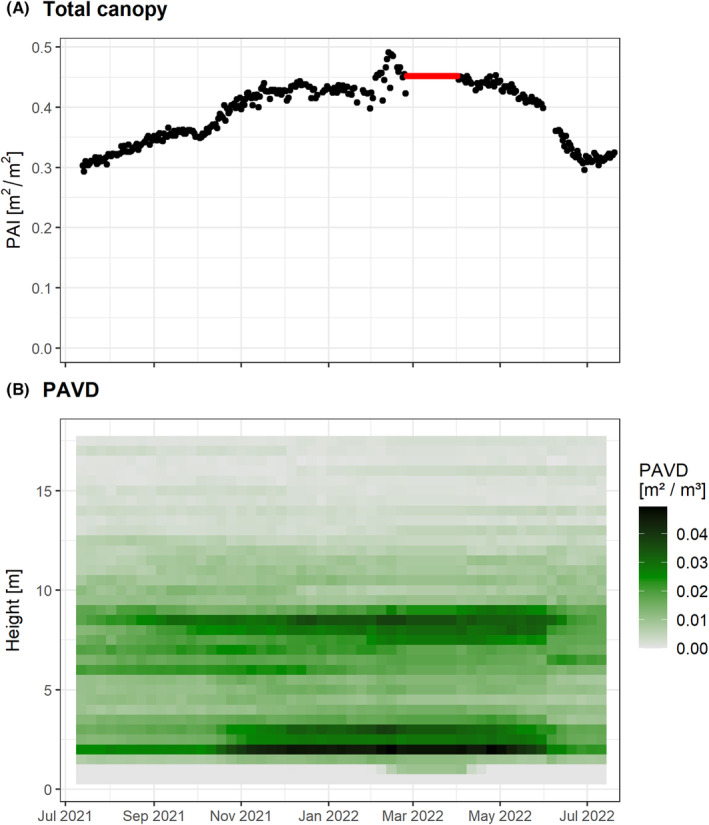
Figure 2.

Time series of (A) total canopy plant area index (PAI) and (B) plant area volume density (PAVD) from high‐temporal laser scanning at a tropical savanna site in Northern Australia. Planned fuel reduction burns were conducted in May 2021 and June 2022. LEAF sensor was installed in mid‐July 2021. Data showing from installation until 20 July 2022. Of the 368 hemispherical scans acquired, 64 scans were identified as rain affected and removed from the analysis. PAVD profiles were calculated for the remaining 304 hemispherical scans at 0.5 m height increments. Gaps in the time series were filled using linear interpolation and then averaged at a weekly timescale for visualization, that is each ‘square’ in the PAVD plot (B) represents 0.5 m in height and 1 week in time. All scans during March were rain affected and discarded with PAVD (and derived PAI) assumed to be static during this time (red line).
