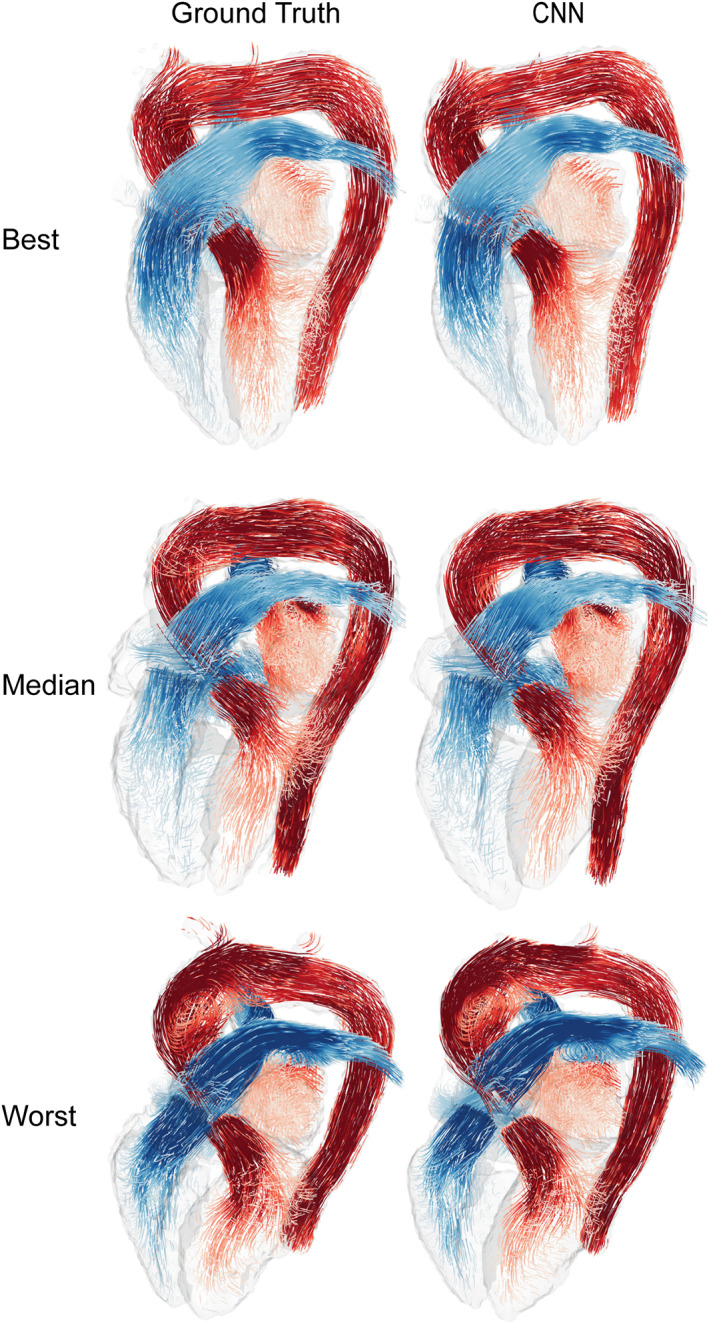
FIGURE 3.

Flow streamlines generated at a mid‐systolic timeframe using the ground truth and CNN results for the best, median, and worst Dice scores. Dice scores of 0.96, 0.91, and 0.86, respectively. Pulmonary flows are depicted using shades of blue, and systemic flows using shades of red. Streamlines were generated independently for each region included in the segmentation.
