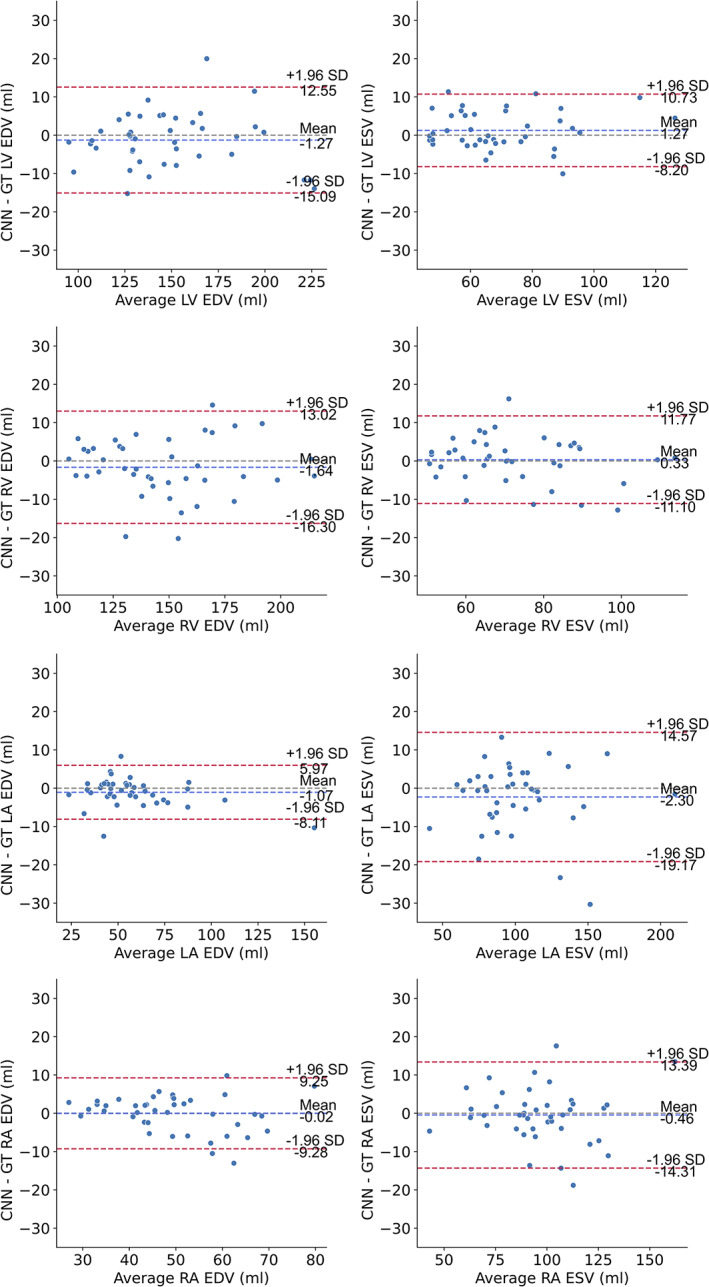
FIGURE 6.

Bland–Altman plots of end‐diastolic volume (EDV) and end‐systolic volume (ESV) for the cardiac chambers. The dashed blue line shows the mean difference, while the dashed red lines denote the 95% limits of agreement (± 1.96 * standard deviation). GT = ground truth; LV = left ventricle, LA = left atrium; RV = right ventricle; RA = right atrium;EDV = end‐diastolic volume; ESV = end‐systolic volume.
