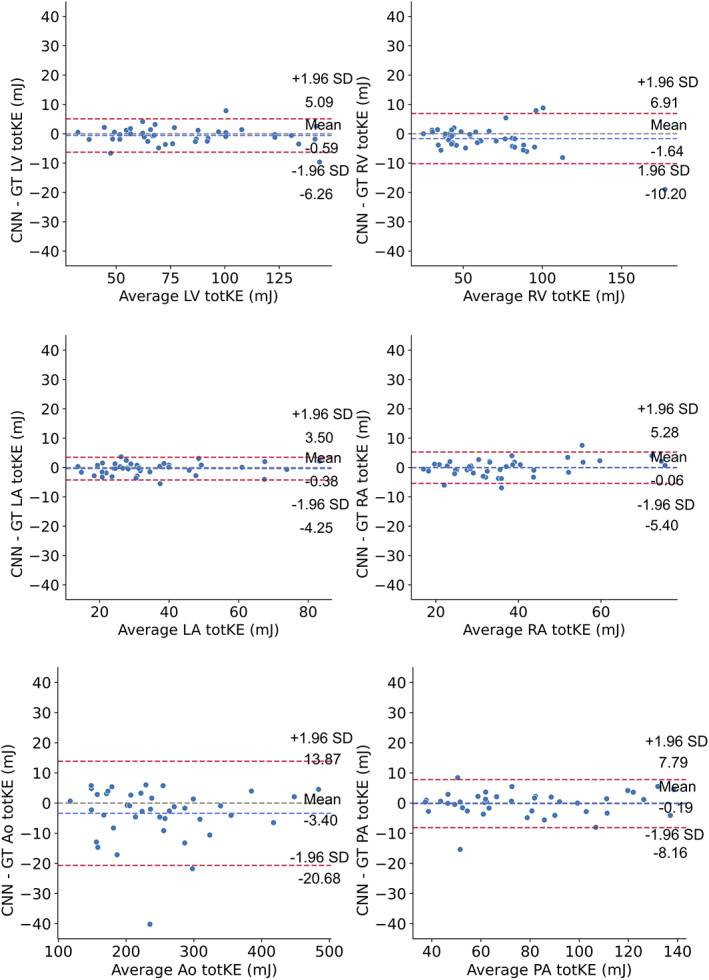
FIGURE 7.

Bland–Altman plots of the total kinetic energy over the cardiac cycle, for all regions. The dashed blue line shows the mean difference, while the dashed red lines denote the 95% limits of agreement (± 1.96 * standard deviation). GT = ground truth; LV = left ventricle; LA = left atrium; RV = right ventricle; RA = right atrium; Ao = aorta; PA = pulmonary artery; tot KE: total kinetic energy.
