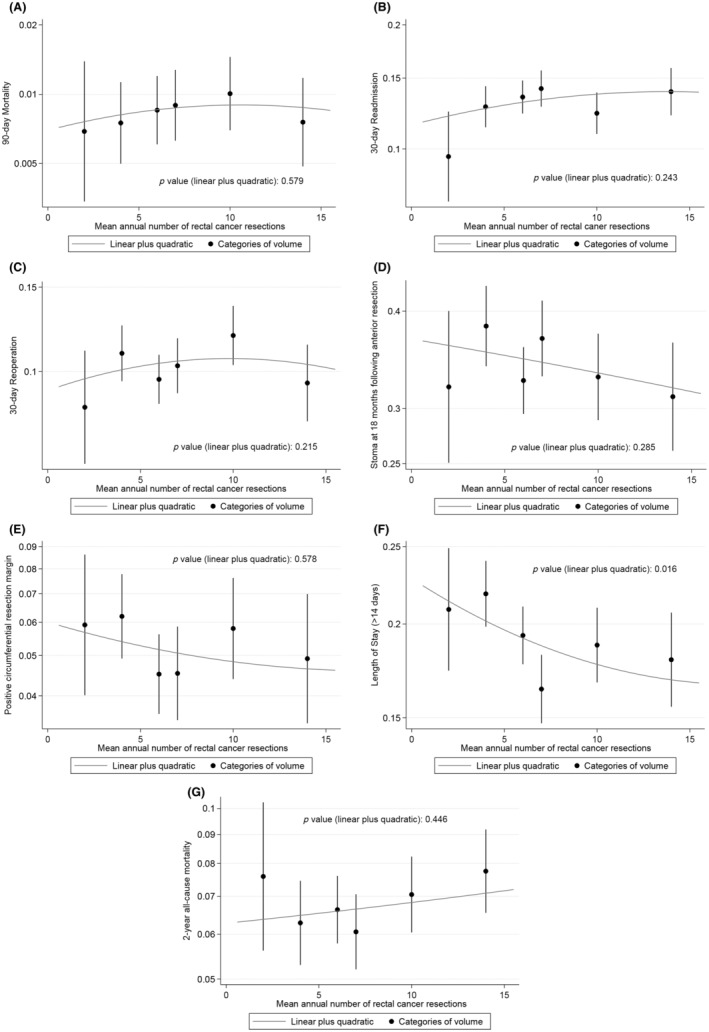
FIGURE 3.

Linear–quadratic graphs showing the risk‐adjusted volume–outcome relationship at surgeon level for: (A) 90‐day mortality; (B) 30‐day unplanned readmission; (C) 30‐day unplanned return to theatre; (D) stoma at 18 months following anterior resection; (E) positive circumferential resection margin; (F) prolonged length of stay (>14 days); and (G) 2‐year all‐cause mortality. The y‐axis is plotted on a risk scale for all graphs.
