
Figure 6.
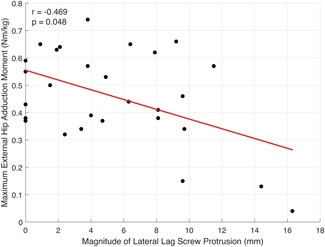
Scatter plot with line of best fit (red) illustrating the Pearson correlation between the magnitude of lateral lag screw protrusion and the maximum hip abduction moment at 6 weeks postoperative [Color figure can be viewed at wileyonlinelibrary.com]