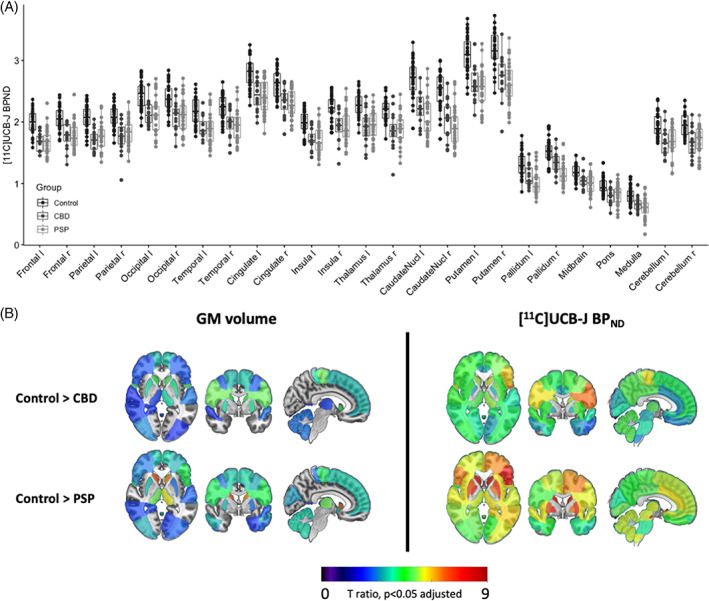
FIG 1.

(A) Baseline regional [11C]UCB‐J BPND in healthy volunteers (n = 31) and patients (progressive supranuclear palsy [PSP], n = 32; corticobasal degeneration [CBD], n = 16) in major regions of interest. (B) t‐Statistic maps comparing regional gray matter (GM) volume and [11C]UCB‐J BPND (CSF corrected) in patients versus controls. Only t values, significant at P < 0.05 adjusted for multiple comparisons, are shown; higher t values illustrate greater volume and synaptic loss; orange/red = more severe atrophy/loss). [Color figure can be viewed at wileyonlinelibrary.com]
