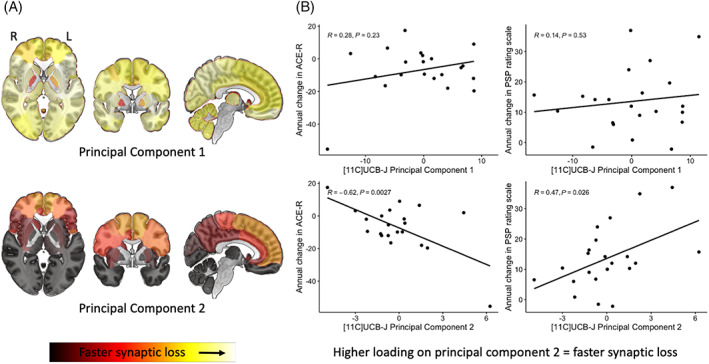
FIG 4.

(A) Brain maps illustrating principal components 1 and 2 weighting (yellow = faster synaptic loss) obtained from a principal‐component analysis of the annualized proportional change in [11C]UCB‐J BPND. (B) Scatterplots showing the relationship between symptom severity (progressive supranuclear palsy [PSP] Rating Scale)/Addenbrooke's Cognitive Examination–Revised (ACE‐R) and individual participant loadings on principal components 1 (top row) and 2 (bottom row). [Color figure can be viewed at wileyonlinelibrary.com]
