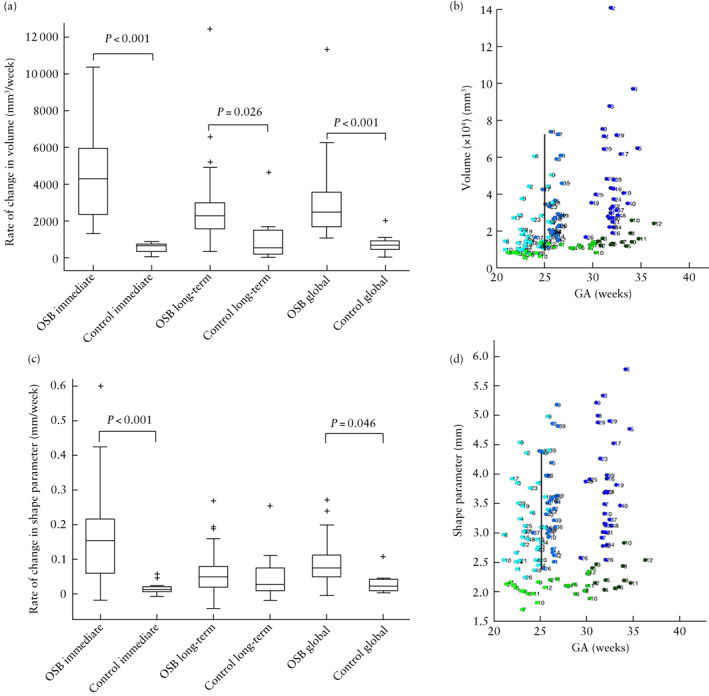
Figure 4.

(a,c) Box‐and‐whiskers plots displaying rate of change in volume (a) and shape parameter (c) of ventricles in fetuses after open spina bifida (OSB) surgery compared with gestational age (GA)‐matched controls during immediate time period (difference between 1 week after fetal surgery and before fetal surgery), long‐term time period (difference between 6 weeks and 1 week after fetal surgery) and global time period (difference between long‐term and immediate time periods). Boxes with internal lines are median and interquartile range (IQR), whiskers are range and crosses are data points lying outside 1.5 × IQR. Only significant comparisons within time periods are indicated. (b,d) Scatterplots displaying volume (b) and shape parameter (d) of ventricles before (Timepoint 1 (T1)), 1 week after (Timepoint 2 (T2)) and 6 weeks after (Timepoint 3 (T3)) fetal surgery, in fetuses with OSB ( , T1;
, T1;  , T2;
, T2;  , T3) and GA‐matched controls (
 , T1;
, T1;  , T2;
, T2;  , T3). Average GA at surgery indicated by black vertical line.
