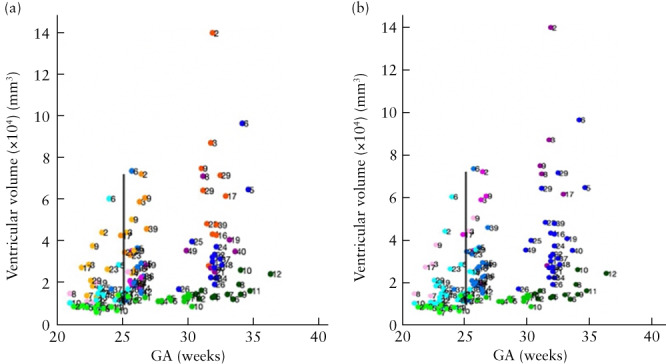
Figure 5.

Scatterplots displaying ventricular volume before (Timepoint 1 (T1)), 1 week after (Timepoint 2 (T2)) and 6 weeks after (Timepoint 3 (T3)) fetal surgery, in fetuses with open spina bifida (OSB) and additional central nervous system (CNS) anomaly, OSB fetuses without additional CNS anomaly ( , T1;
, T1;  , T2;
, T2;  , T3) and gestational age (GA)‐matched controls (
 , T1;
, T1;  , T2;
, T2;  , T3). Additional CNS anomalies were: (a) partial agenesis of corpus callosum (
 , T1;
, T1;  , T2;
, T2;  , T3) or abnormal corpus callosum (
 , T1;
, T1;  , T2;
, T2;  , T3), and (b) persistent hindbrain herniation (
 , T1;
, T1;  , T2;
, T2;  , T3). Average GA at surgery indicated by black vertical line.
