
Figure 2.
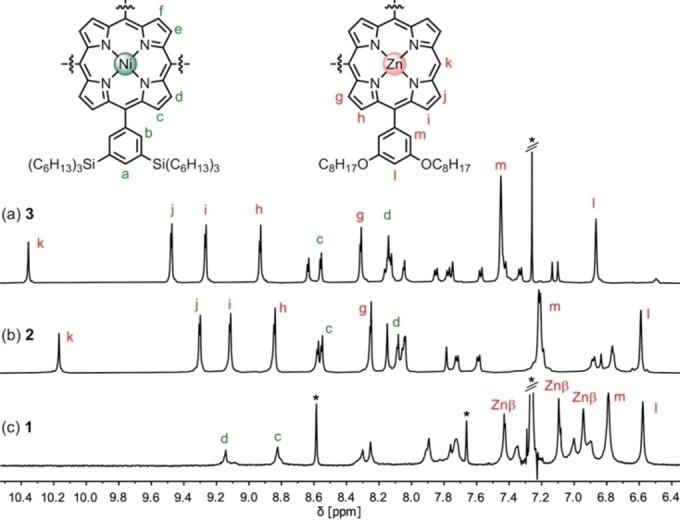
Aromatic region of 1H NMR spectra of: a) 3 (CDCl3), b) 2 (CD2Cl2) and: c) 1 (CDCl3+1 % d5 ‐pyridine; Znβ indicates (g,h,i); 600 MHz, 298 K; * indicates residual solvent peaks in d5 ‐pyridine or CDCl3, see Supporting Information for full assignments.