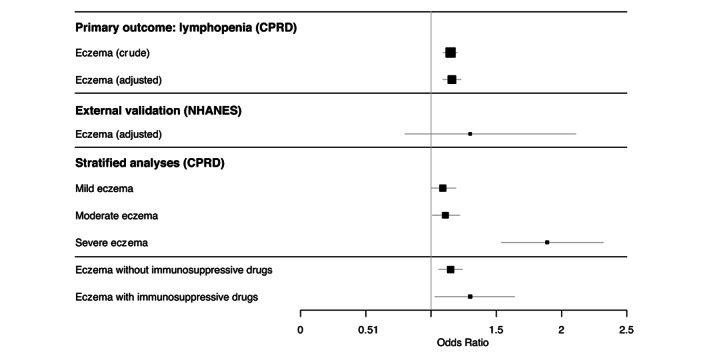
FIGURE 2.

Odds ratios (95% CI) for lymphopenia in people with atopic eczema compared to individuals without atopic eczema (Primary outcome). Larger squares indicate a larger sample size. Lines indicate the 95% confidence intervals. Associated numbers included in the analyses and exact effect estimates, 95% CI and p‐values are reported in Tables S2 and S10. All covariates are described in the methods and were assessed in the analyses. Final adjusted models included smoking and oral glucocorticoid use in addition to age and sex (matching variables). External validation in NHANES were adjusted for the same variables as the adjusted model in CPRD. Stratified models were adjusted as well.
