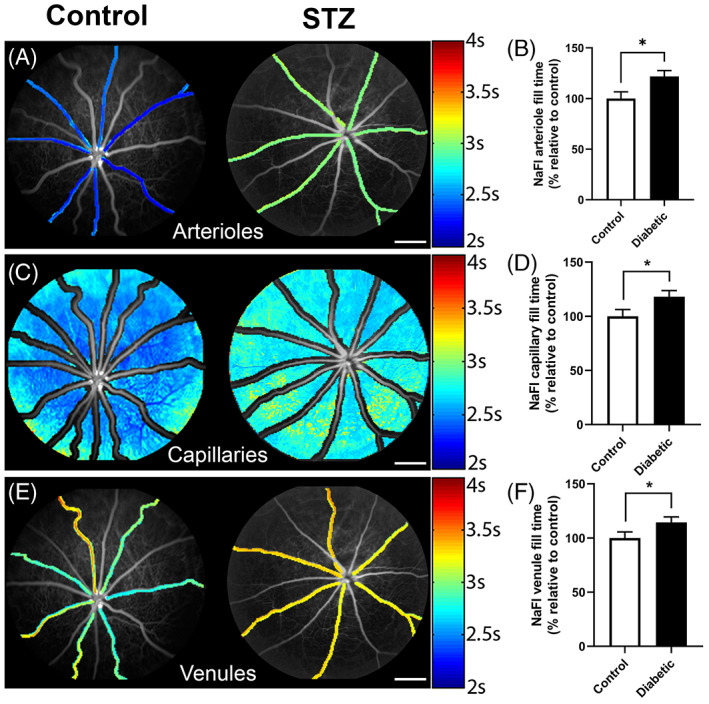
FIGURE 1.

Retinal blood flow is reduced in arterioles, capillaries and venules in the retina during diabetes. Fluorescein angiograms of control and STZ induced diabetic rats showing the blood flow in arterioles, (A) capillaries (C) and venules (E). Rate of flow is indicated by the colour map to the right. Graphs of the mean + SEM fill time in (B) arterioles, (D) capillaries and (F) venules for control and diabetic rats 12 weeks following onset of diabetes. Fill time is expressed as a percentage of the control and shows that it is significantly longer in the diabetic retinae compared to control. N = 10 per group; *p < 0.05 unpaired t test. Source: Figures are adapted from Reference 29
