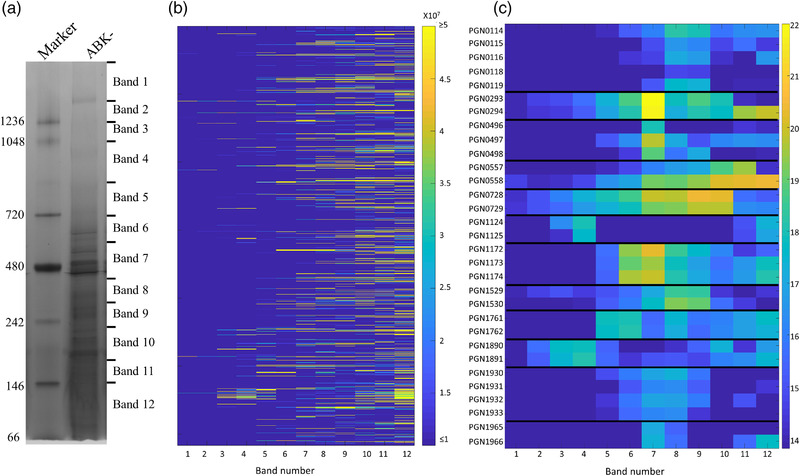
FIGURE 1.

Native migration profiles of P. gingivalis proteins plotted as a heat map. (a) Porphyromonas gingivalis cells lacking the gingipains (ABK‐) were lysed in 1% n‐dodecyl‐β‐d‐maltoside (DDM), electrophoresed on a BN‐PAGE gel and stained with Coomassie brilliant blue G‐250. The gel lane was sliced into 12 bands, and in‐gel tryptic digestion was performed on the gel pieces. Tryptic fragments were analysed by mass spectrometry and identified using MaxQuant software. (b) Migration profile overview of all the proteins identified in each band of the BN‐PAGE gel based on the intensity‐based absolute quantitation (iBAQ) values (average of four replicates). (c) Migration profiles of selected complexes in each band with the iBAQ values expressed on a natural log scale. See also Table S1
