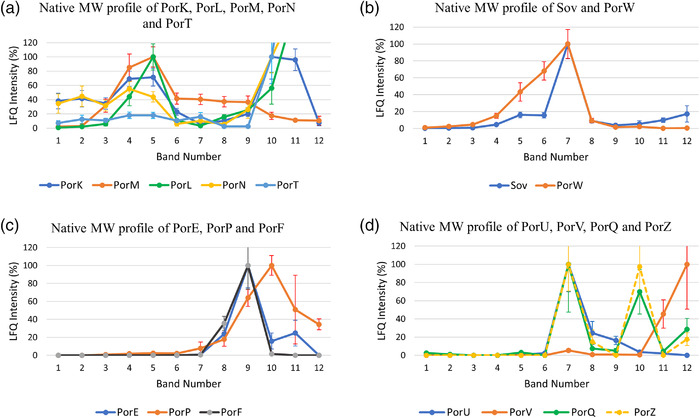
FIGURE 2.

Subcomplexes of the T9SS identified by BN‐PAGE analysis of P. gingivalis ABK‐. The label‐free quantitation (LFQ) intensities for the T9SS proteins identified from each BN‐PAGE band were converted to a percentage with the highest LFQ intensity being assigned 100% for each protein in the group except for PorT, PorL and PorN, where the intensity at band 10 was assigned 100% to aid visualisation of the high molecular weight bands. Proteins that comigrated on a BN‐PAGE gel were grouped and plotted together (a) PorK, PorL, PorM, PorN and PorT, (b) Sov and PorW, (c) PorE, PorP and PorF and (d) PorU, PorV, PorQ and PorZ
