FIGURE 5.

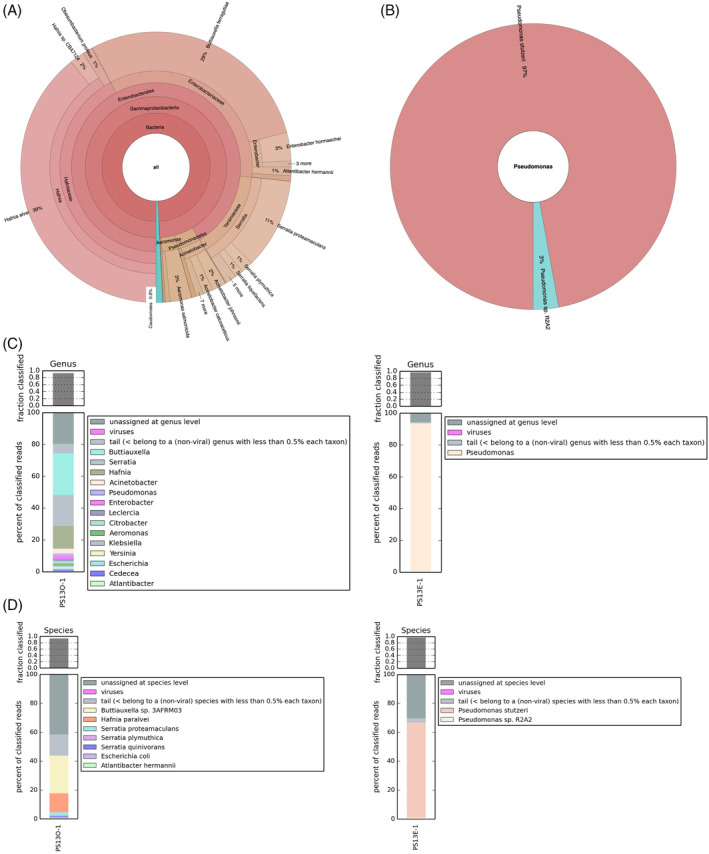
Community analysis of PS13 original and enriched. Krona chart displaying the relative abundance and diversity at the species level of (A) the PS13 original dataset, and (B) the PS13 enriched dataset, generated by GOTTCHA2 from Illumina sequence reads. Kaiju‐generated stacked barplots representing taxonomic classification of PS13 original (PS13O) (shown on left) and PS13 enriched (PS13E) (shown on right) at (C) genus level and (D) species level.
