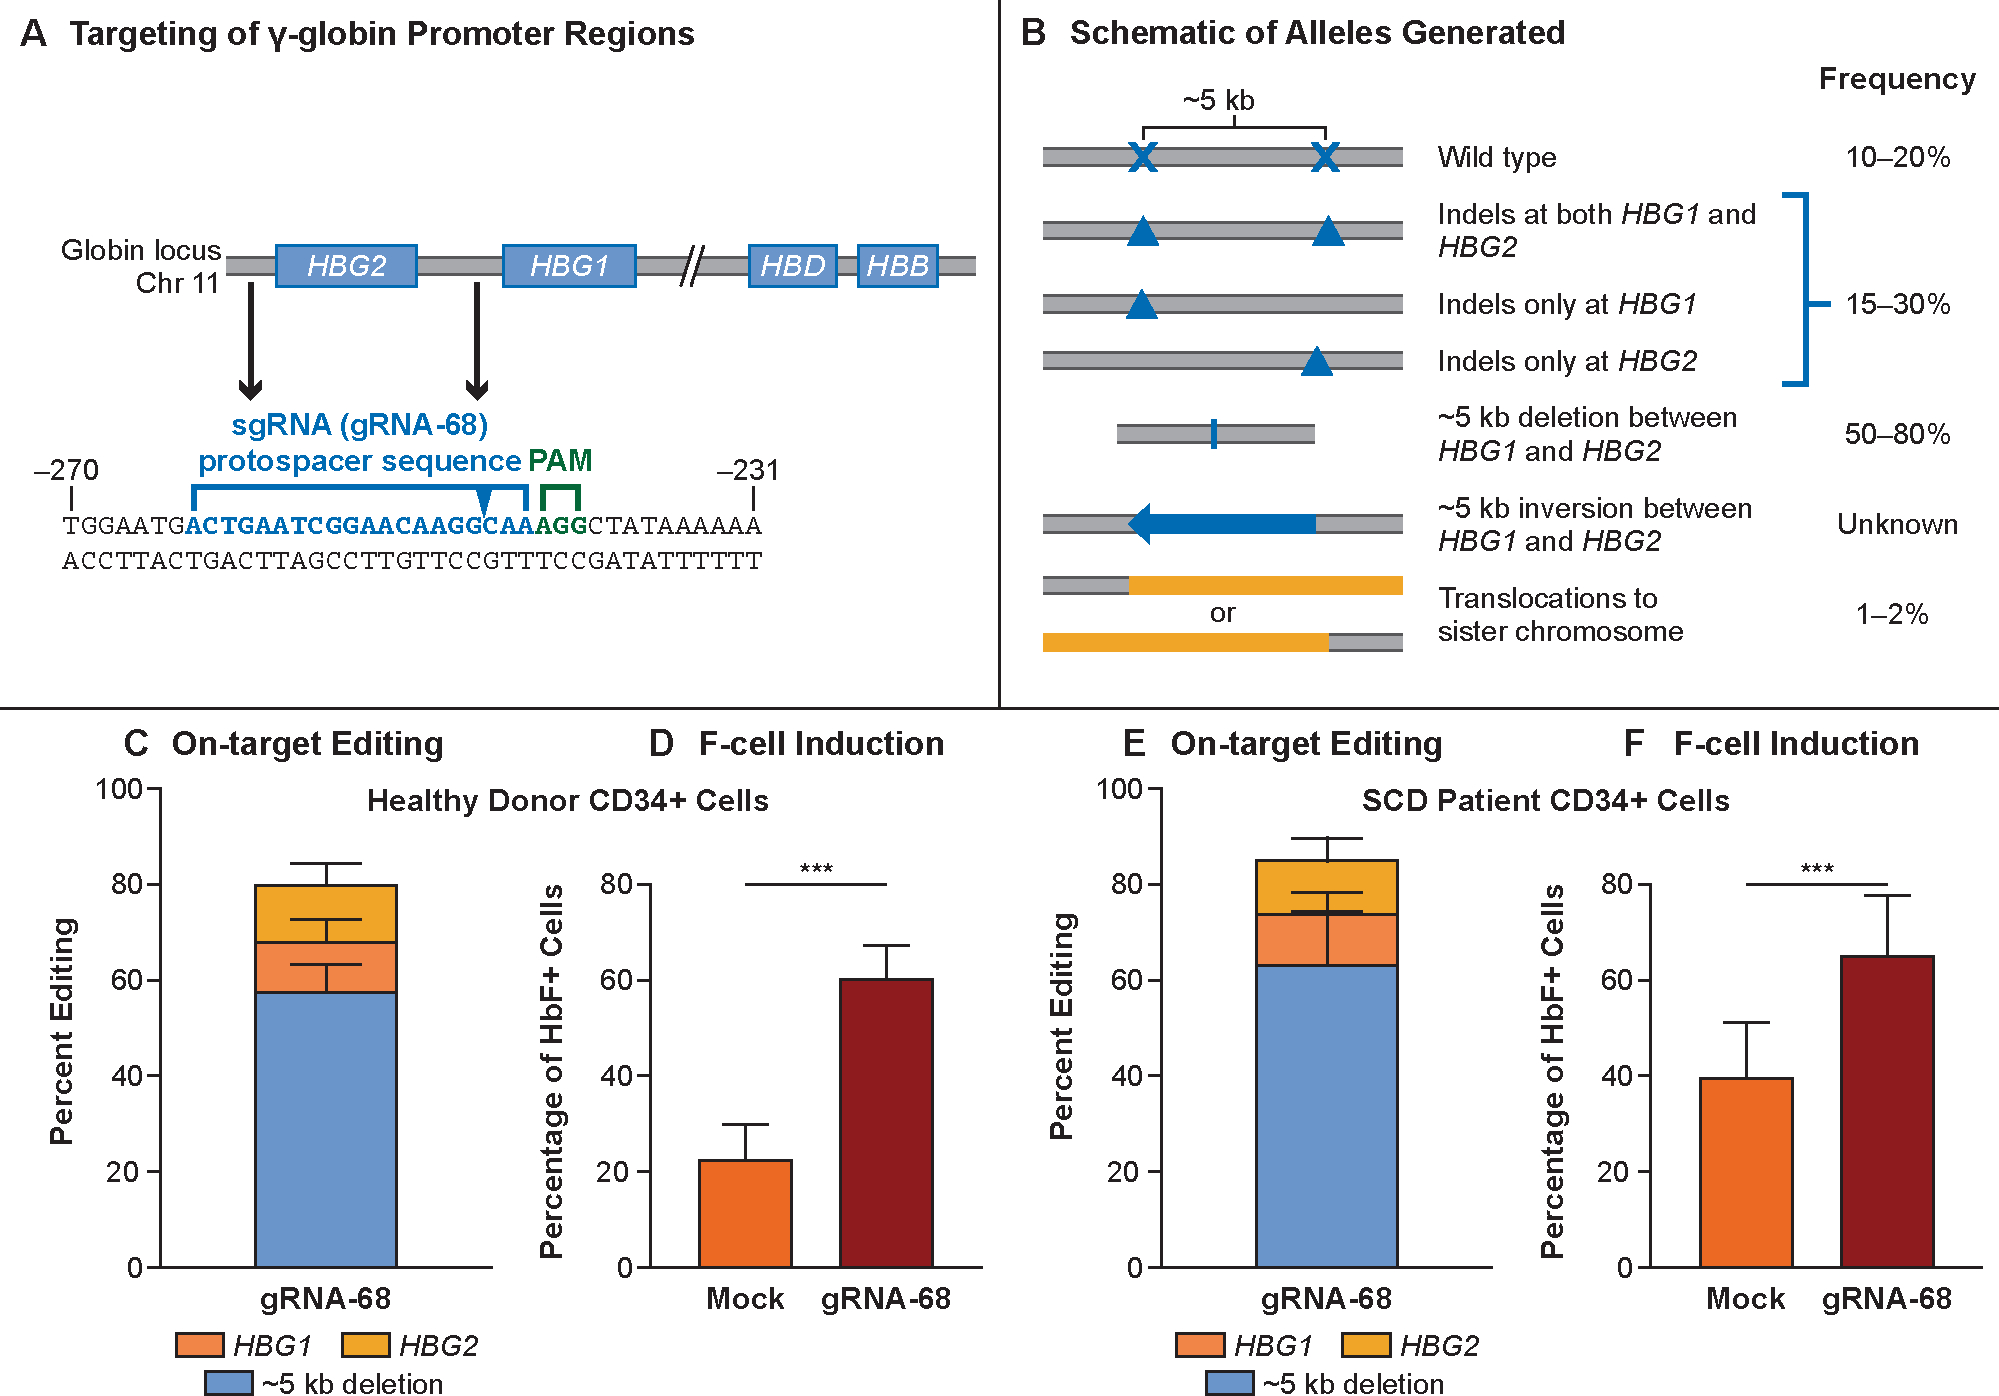
Figure 1. OTQ923 molecular approach and preclinical characterization.

Panel A shows the targeting site of the ribonucleic acid–protein complex (RNP) consisting of Cas9 complexed with guide RNA-68 (gRNA-68). Genes in the β-like globin cluster on chromosome 11 are shown as boxes, with RNP targeting sites in HBG1 and HBG2 promoters indicated. The protospacer sequence of gRNA-68 is shown below in blue, and the protospacer adjacent motif (PAM) sequence is shown in green. The sequence is numbered in accordance with the start of transcription being at +1. The predicted cutting site is indicated by the blue arrow in the protospacer sequence. Panel B shows the editing outcomes as determined by qPCR,30 targeted NGS, and UnIT (Supplemental Methods). Most edits generated a deletion of ~5 kb caused by simultaneous double-stranded DNA breaks at the two target sites, thereby generating a single functional HBG2–HBG1 fusion gene with the HBG2 promoter sequence fused to the downstream HBG1 (48.8–87.4% alleles). Editing also resulted in small indels at either targeting site that accounted for 7.1–36.9% of alleles. No inversion of the ~5-kb fragment was detected. Panel C shows the distribution of editing outcomes in OTQ923 or control cells generated from healthy-donor CD34+ cells (n=4). Panel D shows the percentages of F-cells in erythroblasts generated by in vitro differentiation of OTQ293 or control cells described in Panel C (n=4 healthy donors). Panel E shows the amount of HbF protein estimated by HPLC in erythroblasts generated by in vitro differentiation of OTQ293 or control cells derived from healthy donors (n=2 healthy donors). Panel F shows the distribution of editing outcomes in OTQ923 cells or control cells generated from individuals with sickle cell disease (n=4). Panel G shows the percentages of F-cells in erythroblasts generated by in vitro differentiation of OTQ293 or control cells described in Panel E (n=3 sickle cell disease donors). Panel H shows the amount of HbF protein estimated by HPLC in erythroblasts generated by in vitro differentiation of OTQ293 or control cells derived from sickle cell disease patients (n=3). All graphs show data as the mean ± SD.
