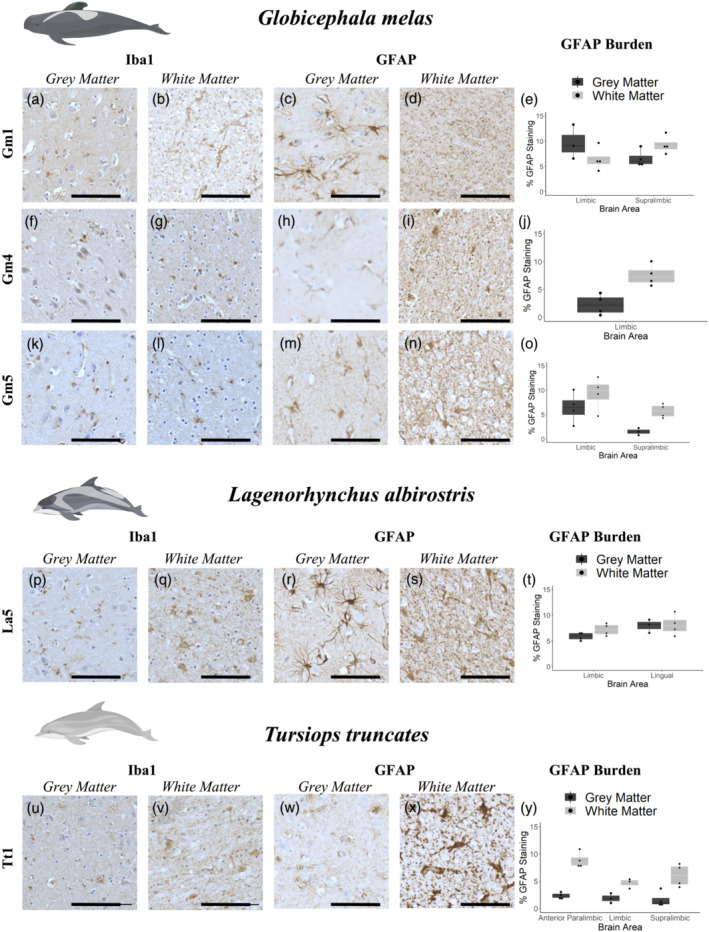
FIGURE 5.

Immunohistochemical labelling (brown pigment) of astrocytes and microglia in grey and white matter from Globicephala melas (a–o), Lagenorhynchus albirostris (p–t) and Tursiops truncatus (u–y). All animals have both Aβ and pTau pathology as assessed by IHC, with the exception of Gm4 whose pTau status was not determined. Due to sample availability, different brain regions were assessed for each animal, with GFAP burden values are reported as % area of the image occupied by GFAP labelling. Graphs show an average ±SEM of 5 200 × 200 μm randomly selected regions of interest from both grey and white matter in each brain region (e,j,o,t,y). Iba1 labelling was fairly weak in all animals, although individual cells were resolvable in some sections, notably white matter from La5 (q) and Tt1 (v). GFAP labelling was clearer, with individual cells clearly resolvable in grey matter from Gm1 (c), Gm4 (h), Gm5 (m) and La5 (r). Tt1 showed a different pattern, with highly diffuse labelling in grey matter (w), but more readily resolvable cells in white matter (x), in contrast to the more punctate/mesh‐like GFAP labelling in white matter from other animals (d,i,n,s). Iba1 and GFAP labelling seemed uniformly distributed through grey/white matter, with little evidence of gliosis as may be seen around neuritic plaques in human Alzheimer's disease brain. Data are shown as box plots with each individual animal mean as data points. Scale bars = 100 μm
