FIGURE 2.

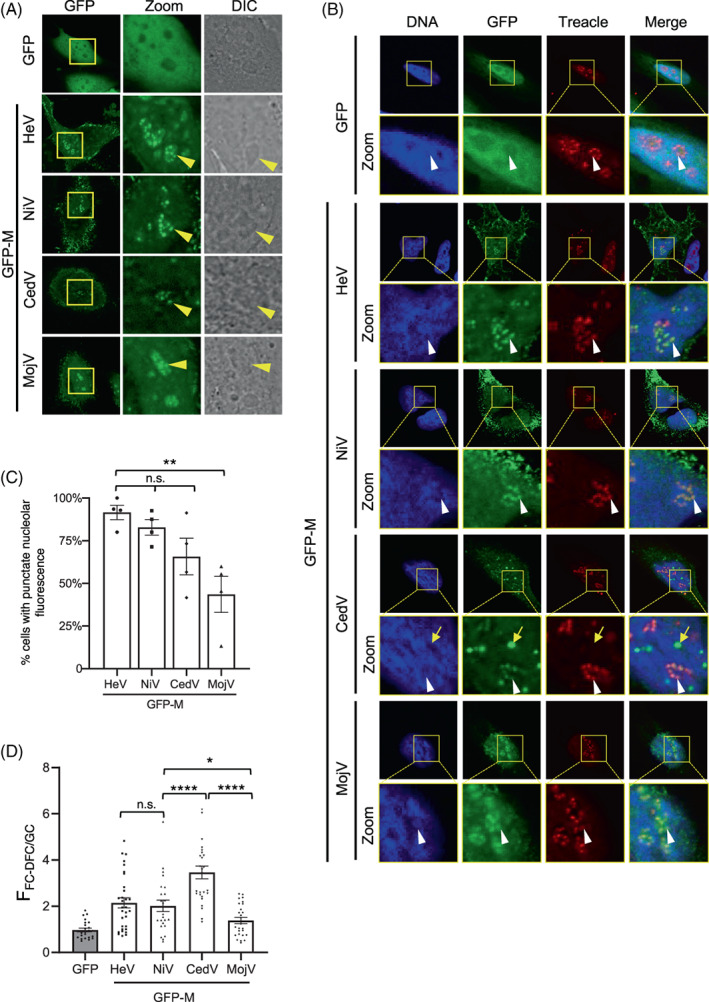
Henipavirus M proteins target the FC‐DFC and colocalise with Treacle. (A) HeLa cells were transfected to express the indicated proteins before analysis of living cells by CLSM. Images are representative of ≥5 independent experiments; ≥10 fields of view were captured for each experiment. Differential interference contrast (DIC) microscopy was used to identify nucleoli. Yellow arrowheads indicate individual nucleoli. (B) HeLa cells transfected to express the indicated proteins were fixed and immunolabelled for Treacle using AlexaFluor‐568‐conjugated secondary antibodies (red fluorescence). Images are representative of ≥7 fields of view. Yellow boxes highlight regions magnified in the Zoom panels. White arrows indicate individual FC‐DFC containing Treacle/M protein; yellow arrow highlights GFP‐CedV M puncta outside of nucleoli. Nuclei/DNA was labelled using Hoechst 33342 dye. (C) Images such as those in A were analysed to determine the percentage of cells expressing the indicated proteins where punctate distribution of nucleolar fluorescence for M protein was evident (mean % ± SEM, n = four independent experiments with analysis of ≥85 cells for each condition). (D) Images such as those shown in A were analysed to determine the FFC‐DFC/GC for GFP alone and the inicated henipavirus GFP‐M proteins. Data shown is from one assay (n ≥ 22 cells for each condition), representative of three independent assays. Statistical analysis used Student's t‐test; *p < 0.05; ** p < 0.01; *** p < 0.001; **** p < 0.0001; n.s., nonsignificant.
