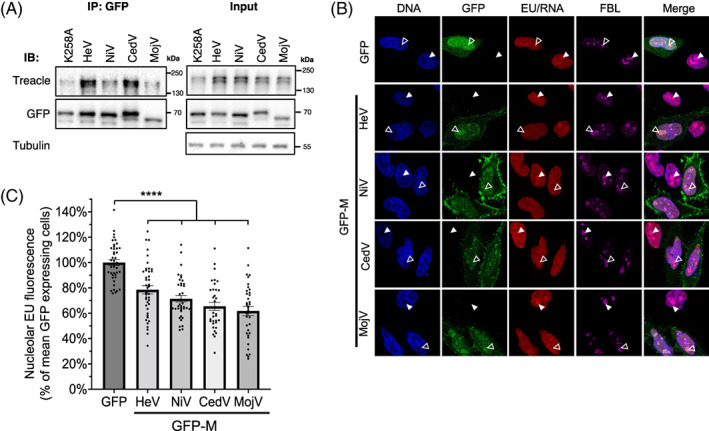
FIGURE 3.

Henipavirus M proteins bind to Treacle and inhibit rRNA synthesis. (A) IPs of the indicated proteins from transfected HEK‐293T cells were analysed by IB with the indicated antibodies; results are representative of >3 independent experiments. (B) HeLa cells were transfected to express the indicated GFP‐fused proteins for 20 h before labelling of nascent RNA and fixation using the ClickiT™ RNA synthesis imaging kit, as previously described. 11 Cells were labelled using antibodies to the nucleolar protein, fibrillarin (FBL; marker for the FC‐DFC), and Hoechst 33342 (DNA), before imaging using CLSM. White unfilled arrowheads indicate individual nucleoli of cells expressing GFP/GFP‐M, and filled arrowheads indicate nucleoli of cells not expressing GFP. (C) Images such as those in B were analysed to quantify nascent rRNA (histogram shows mean nucleolar EU fluorescence ± SEM as a percentage of the mean intensity of GFP alone expressing cells (control); n ≥ 34 cells analysed for each condition; data from a single assay; comparable inhibition of rRNA synthesis by the M proteins was observed in ≥3 independent assays. Statistical analysis used Student's t‐test; ****p < 0.0001.
