
Figure 8.
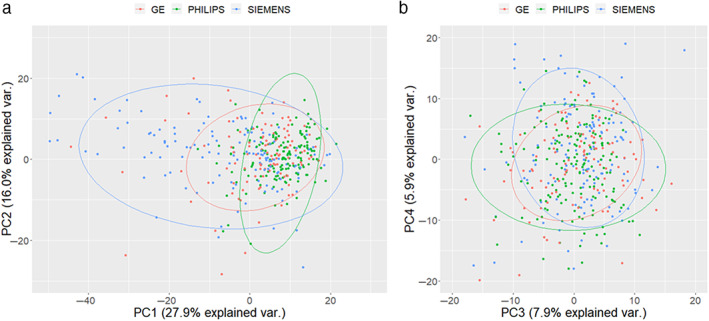
Scanner difference study. Principal component analysis for radiomics features from a different scanner. (a) First principal component (PC1) vs. second principal component (PC2); a relatively larger variation was observed using the Siemens scanner. (b) Third principal component (PC3) and fourth principal component (PC4) explain smaller percentages of the total variation, and the three different scanners show good agreement. The dots in the figure represent samples; the colors represent groups (scanner types); and the legends have three groups at the top. The ellipse represents the core area added by the default confidence interval of 68%, which facilitates the separation between the observation groups. No clear separation of the sample based on the three MRI vendors was observed. var. = variance; PC = principal component.