Figure 1.
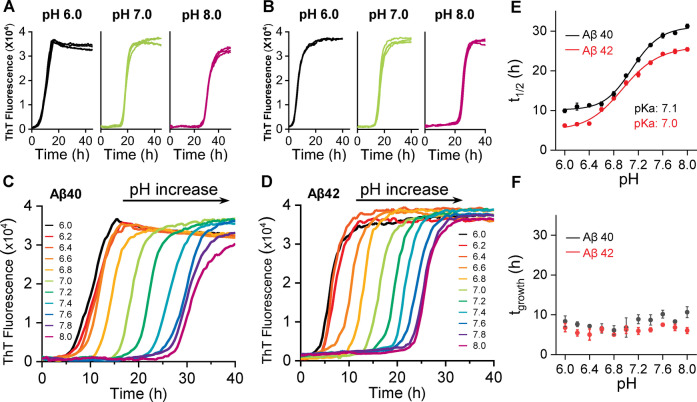
pH‐dependent fibril formation kinetics of Aβ40 and Aβ42. ThT kinetic traces (n=4) at pH 6.0, 7.0 and 8.0 for Aβ40 (A) and Aβ42 (B), see also supplemental S2 and S3. Single representative traces for Aβ40 (C) and Aβ42 (D) between pH 6.0–8.0, from left (black, pH 6.0) to right (purple, pH 8.0). E) Plots of t 1/2 versus pH, with pK a fitted. F) Plots of growth‐time versus pH; error bars are standard error of the mean (SEM) from four replicates.

