
FIGURE 2.
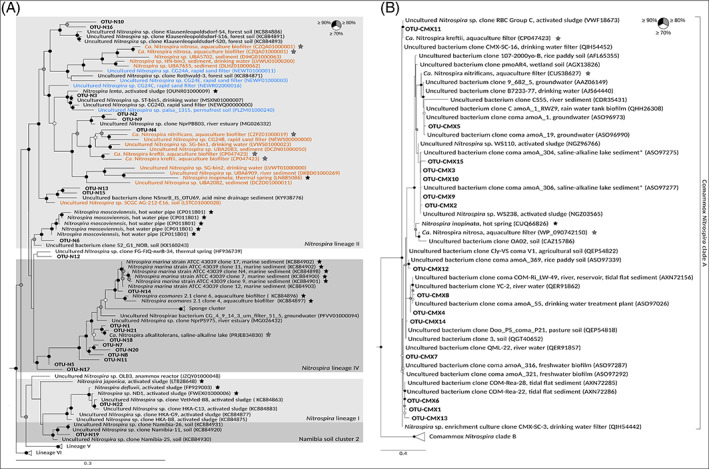
Phylogenetic maximum likelihood analysis of canonical and comammox Nitrospira in lakes HS and US. The trees show the affiliations of Nitrospira nxrB (A) sequences and Nitrospira AmoA (B) sequences, which were retrieved from monthly samples and from sediment microcosms, to reference sequences. Sequences obtained from in this study are printed in bold. The nxrB gene sequences of cultured cultured Brocadia, Jettenia, Kuenenia, Scalindula, and Nitrospina species and the AmoA gene sequences of cultured Nitrosomonas, Nitrososphaera, and Nitrosocosmicus species were used as outgroups for the Nitrospira nxrB and Nitrospira AmoA tree, respectively. The phylogenetic calculations included model prediction by ModelFinder (Kalyaanamoorthy et al., 2017), which identified the best‐fit models to be GTR + F + I + G4 and LG + F + G4 for the Nitrospira nxrB and Nitrospira AmoA trees, respectively. The Nitrospira AmoA sequences obtained from sediment of lake HS in an earlier study (Pjevac et al., 2017) are marked with an asterisk (B). Sequences of nxrB (A) shown in red or blue are affiliated with comammox Nitrospira clade A or B (as identified by Amo gene‐containing, high‐quality MAGs or genomes from cultured strains), respectively. Black and grey stars indicate isolates and enrichment cultures, respectively. Circles at nodes indicate statistical support of branches (1000 bootstrap iterations). The scale bar indicates 30% (A) and 40% (B) estimated sequence divergence.