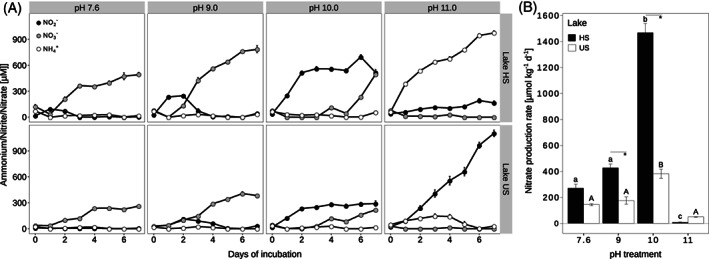
FIGURE 3.

Nitrification activity in pH‐controlled microcosm incubations. (A) Concentrations of nitrite, nitrate, and ammonium in the microcosms during the incubations. The data are split according to the pH treatments. Data points represent means of replicate microcosms (n = 4). (B) Gross nitrifications rates determined during the last 24 h of the microcosm incubations. The bars represent means of replicate microcosms (n = 4) with standard errors. Lower‐ and upper‐case letters indicate significant differences between microcosms for the same lake HS and US, respectively, while asterisks show significant differences between microcosms for different lakes at a given pH condition. HS, lake Herrensee; US, lake Unterer Stinkersee. Error bars (s.e.m. in both panels) are not visible if smaller than symbols.
