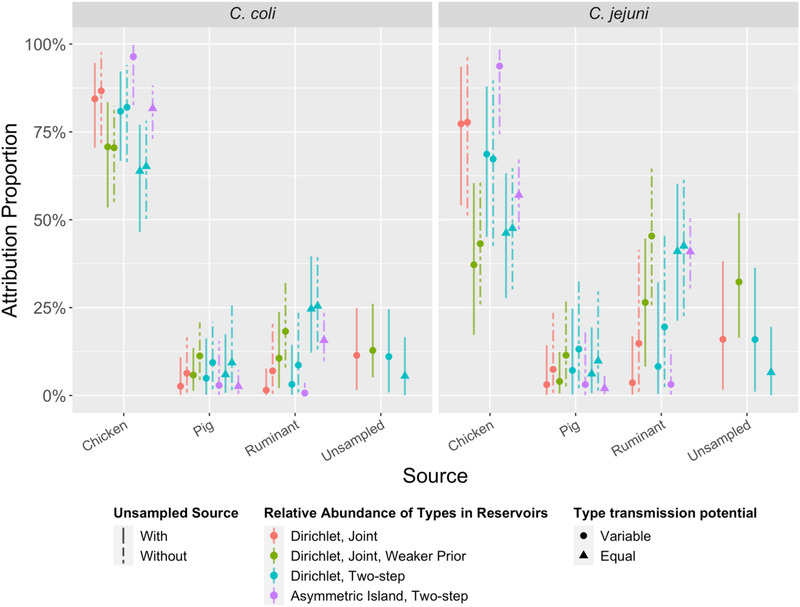
FIGURE 1.

Source attribution proportions of C. jejuni and C. coli cases to three sampled sources (chicken, pig, and ruminant) in 10 models (M1–M10, left to right). Four models (M1, M3, M5, M8) also include a fourth, “unsampled source.” The asymmetric island model is intrinsically unable to accommodate an unsampled source. See Table 1 for the list of assumptions for each model.
