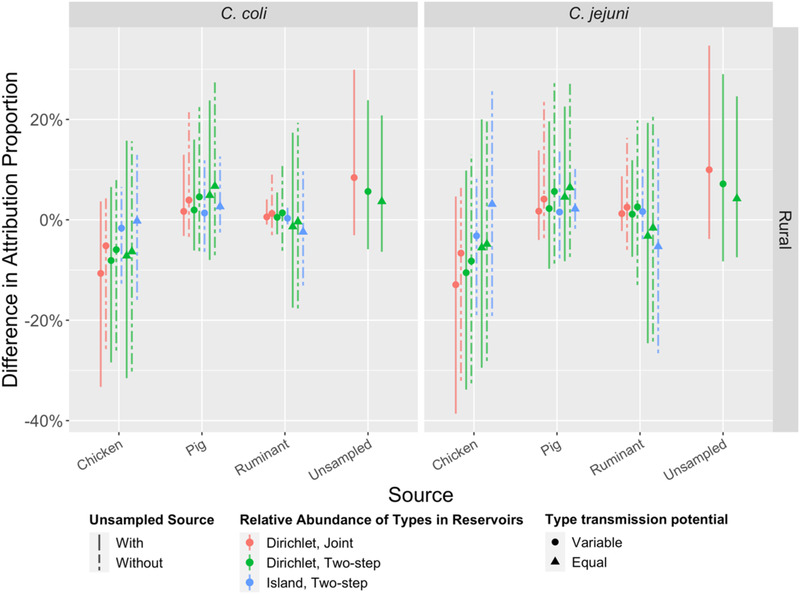
FIGURE A3.

Percent difference in source attribution proportions between urban and rural populations (urban cases as references) for eight models (M1, M2, M5–M10). See Table 1 for model details. Vertical bars are 95% credible intervals (CrI). Note that all CrIs include 0% (no difference).
