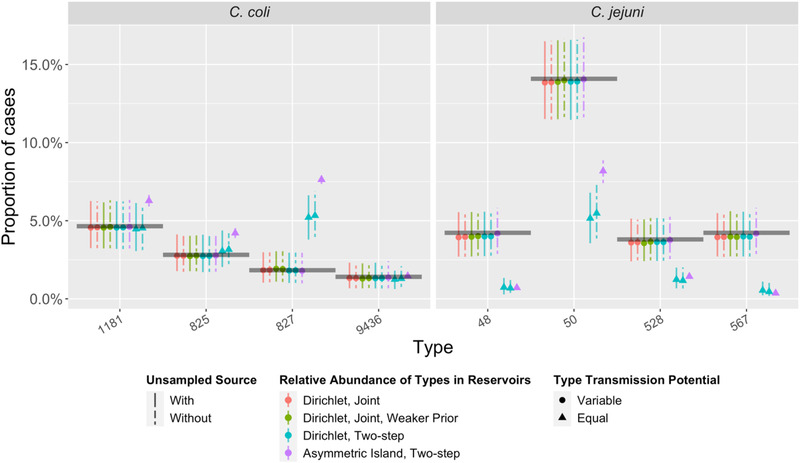
FIGURE A4.

The observed proportion of cases due to the five most common multi‐locus sequence types (STs) from C. coli and C. jejuni (black horizontal lines) compared to predictions (colored points and vertical 95% credible intervals) under 10 source attribution models (M1–M10, left to right). Note that for some STs, the credible intervals for M10 (asymmetric island model) are so narrow that they are not visible.
