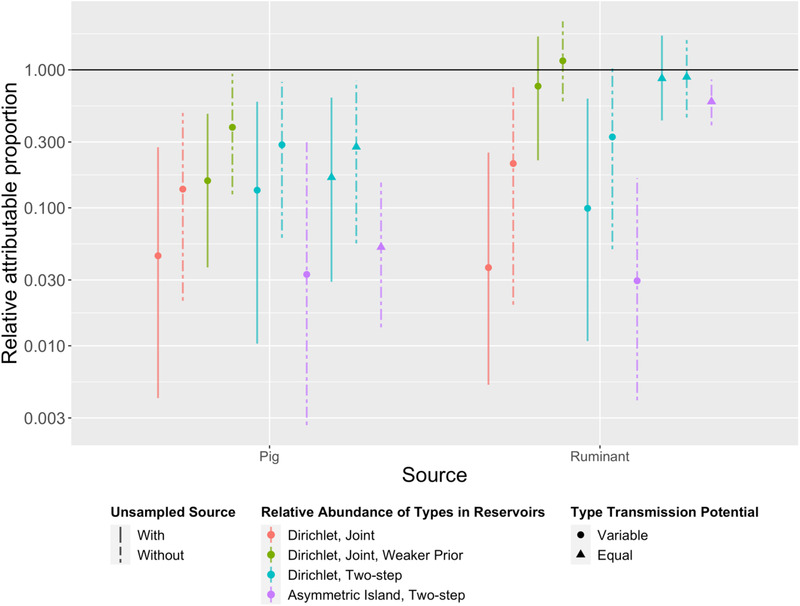
FIGURE A5.

Estimates of relative attributable proportion (RAP) of campylobacteriosis under 10 source attribution models (M1–M10, left to right). RAP was calculated by dividing attribution proportion by the annual Australian consumption of meat products derived from that source and normalized against a reference source (chicken). All models indicated pig meat poses less risk (lower RAP) than chicken. Note the y‐axis is on a log scale, and that the “unsampled source” is omitted due to lack of respective consumption statistics or appropriate equivalent exposure measure.
