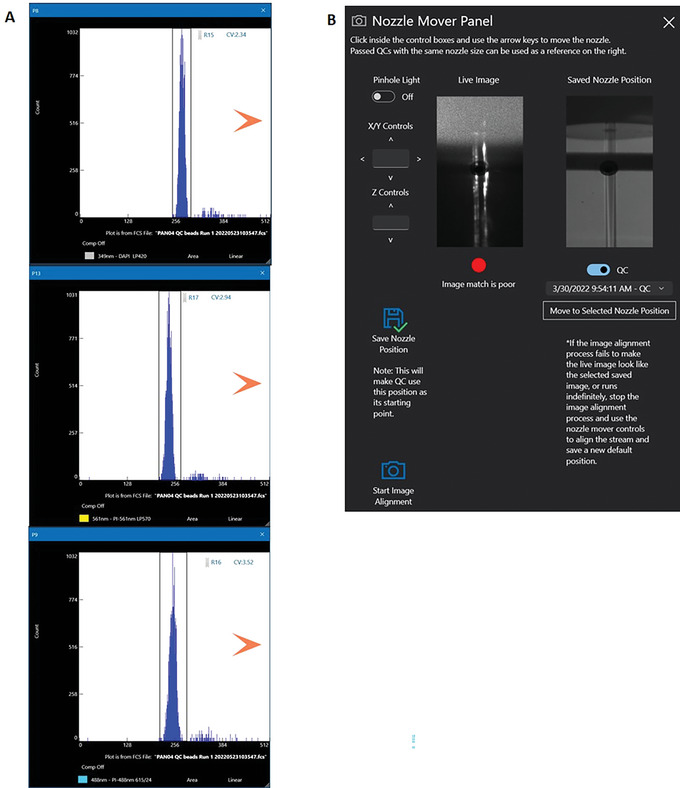
Figure 8.

Histogram plot for parameters from 349‐, 561‐, and 488‐nm lasers. Set a region gate for each of the displayed histograms (A) Using the Nozzle Mover Panel control, align the lasers with minimum CVs for the DAPI and PI fluorescence channels (B).
