Figure 9.

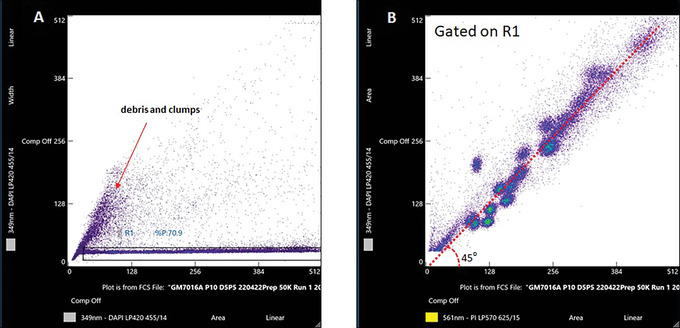
Data plots for chromosome analysis on an Invitrogen Bigfoot cell sorter. (A) 349 nm‐LP420 (Area‐Linear) versus 349 nm‐LP420 (Width‐Linear) (B) 349 nm‐LP420 (Area‐Linear) versus 561 nm‐PI LP570 (Area‐Linear).

Data plots for chromosome analysis on an Invitrogen Bigfoot cell sorter. (A) 349 nm‐LP420 (Area‐Linear) versus 349 nm‐LP420 (Width‐Linear) (B) 349 nm‐LP420 (Area‐Linear) versus 561 nm‐PI LP570 (Area‐Linear).