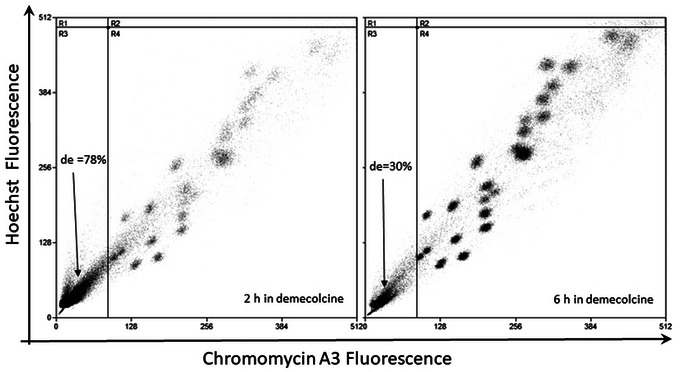
Figure 13.

Bivariate flow karyotype plot of chromosomes from a human lymphoblastoid cell line. The cells were treated with 0.1 µg/ml demecolcine for 2 hr and 6 hr. Chromosomes were stained using the conventional dye combination of HO and CA3. The percentage of debris (de) generated during the chromosome isolation process was calculated by drawing a quadrant on the debris region and is shown in each panel. DNA containing debris is located at the lower left hand corner of the plots.
