FIGURE 3.

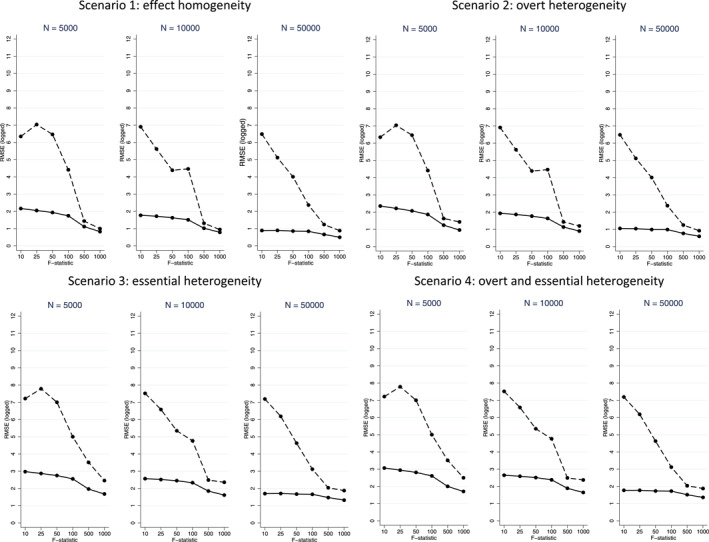
Root Mean Squared Error (RMSE) plots for Average Treatment Effect (ATE) estimates from 2SLS (dashed line) and LIV (solid line) across the scenarios, with sample sizes (N) of 5000 (left), 10,000 (middle) and 50,000 (right).

Root Mean Squared Error (RMSE) plots for Average Treatment Effect (ATE) estimates from 2SLS (dashed line) and LIV (solid line) across the scenarios, with sample sizes (N) of 5000 (left), 10,000 (middle) and 50,000 (right).