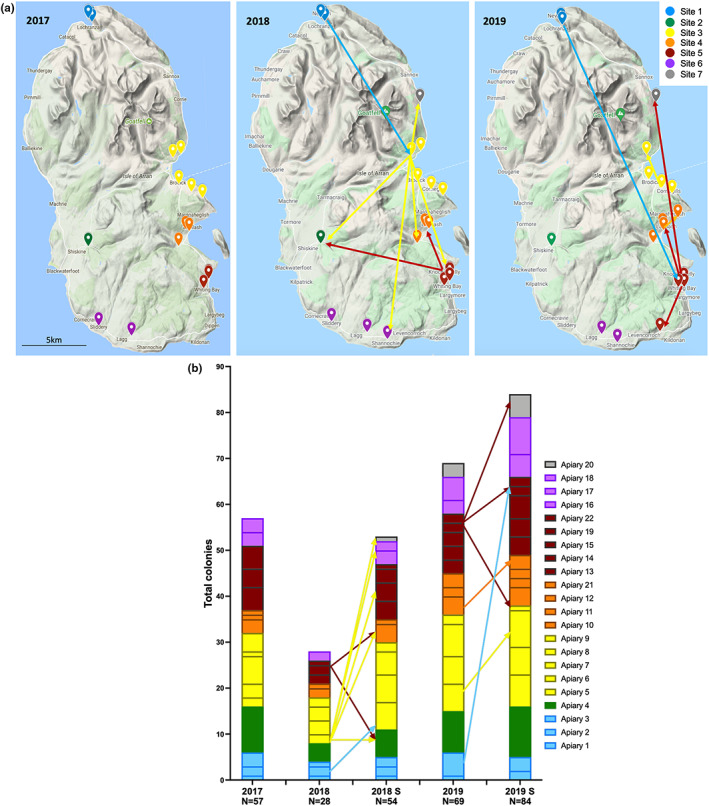
FIGURE 1.

Apiary locations, sites and colony movements throughout study. (a) Apiary locations during the study period on the Isle of Arran. Each marker indicates a single apiary, coloured by site. The arrows on the 2018 and 2019 maps indicate the movement of colonies, coloured by site, from the source to destination apiary. (b) Bar plot indicating the total number of colonies at each sample collection point as a percentage of the total. The same arrows as A are shown, indicating colony movements.
