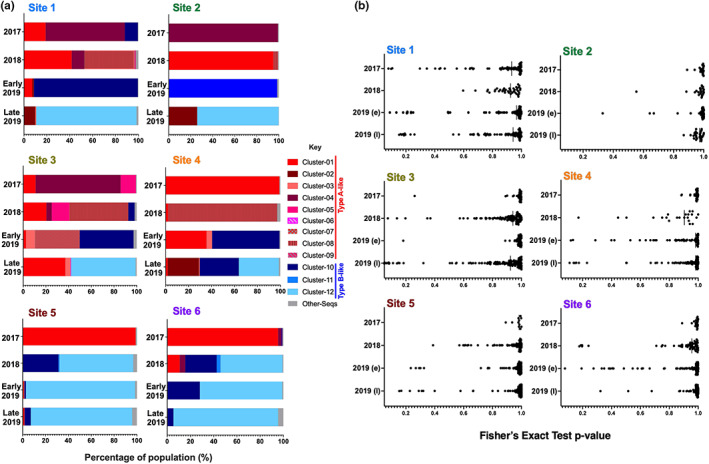
FIGURE 2.

Barplot analysis of DWV haplotype clusters and associated SNV analysis for each site. (a) The assigned clusters from the phylogenetic analysis were used to generate bar plots for each site and year. The clusters were coloured shades of red for Type A like sequences and shades of blue for Type B like sequences. Sequences which fall below the QC limit, defined as 2% in the materials and methods, are classed as ‘other‐seq’. A breakdown of the percentage of each set assigned to each cluster is shown in Table S1. (b) Single nucleotide variants (SNVs) for the RdRp region generated from ShoRAH analysis for all samples from Arran were called if present in 3/3 iterations of the modelling. SNV p‐values close to 1.0 represent a variant in the majority of sequences in that dataset differing from the reference sequence. Samples with SNVs with lower p‐value scores therefore have a greater amount of sequence variation within the sample. Anything with a p‐value ≤ 0.05 was excluded as the threshold for error based on McElroy et al. (2013) modelling data.
