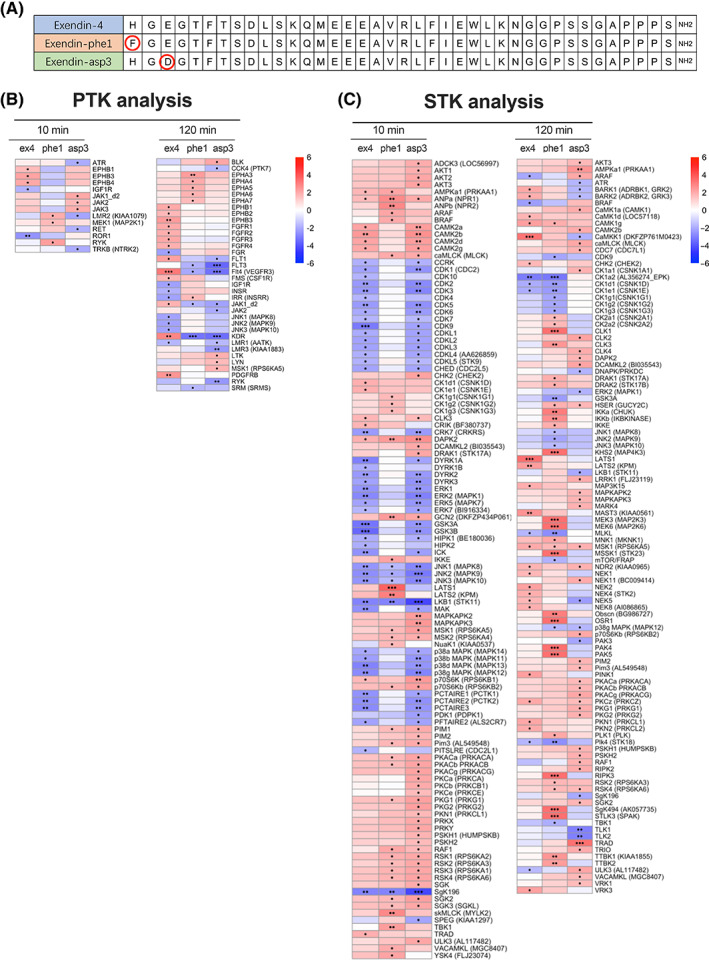
FIGURE 2.

Kinase activity profiles of EndoC‐βh1 cells following acute and sustained GLP‐1R stimulations with exendin‐4, ‐phe1 and ‐asp3. A, Peptide sequences of exendin‐4 (ex4), exendin‐phe1 (phe1) and exendin‐asp3 (asp3). B, Heatmap visualization of PTK z scores, predicting kinase activity downstream of the indicated treatment. C, As for (B) for STK scores. Positive z scores (shown in red) indicate increased kinase activity, while negative z scores (shown in blue) indicate decreased kinase activity compared with vehicle conditions; •P < .05, ••P < .01, •••P < .001; P values were determined by one‐tail t‐tests. GLP‐1R, glucagon‐like peptide‐1 receptor; PTK, protein tyrosine kinase; STK, serine/threonine kinase
