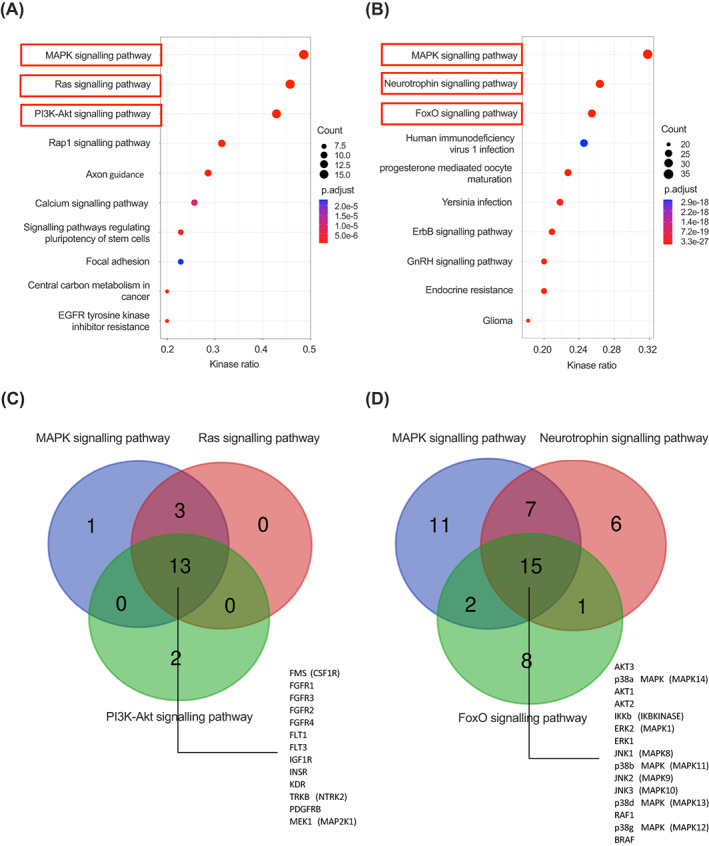
FIGURE 3.

Pathway analysis for predicted kinases. A, Top 10 KEGG pathways for identified Tyr kinases ranked by kinase ratio. B, As for (A) for Ser/Thr kinases. Dot sizes reflect kinase counts and dot colours adjusted P values; red boxes represent selected pathways. C, Venn diagram of selected KEGG pathways for Tyr kinases. D, As for (C) for Ser/Thr kinases. Numbers shown in the overlapping areas indicate intersecting kinases involved in the represented pathways. KEGG, Kyoto Encyclopedia of Genes and Genomes
