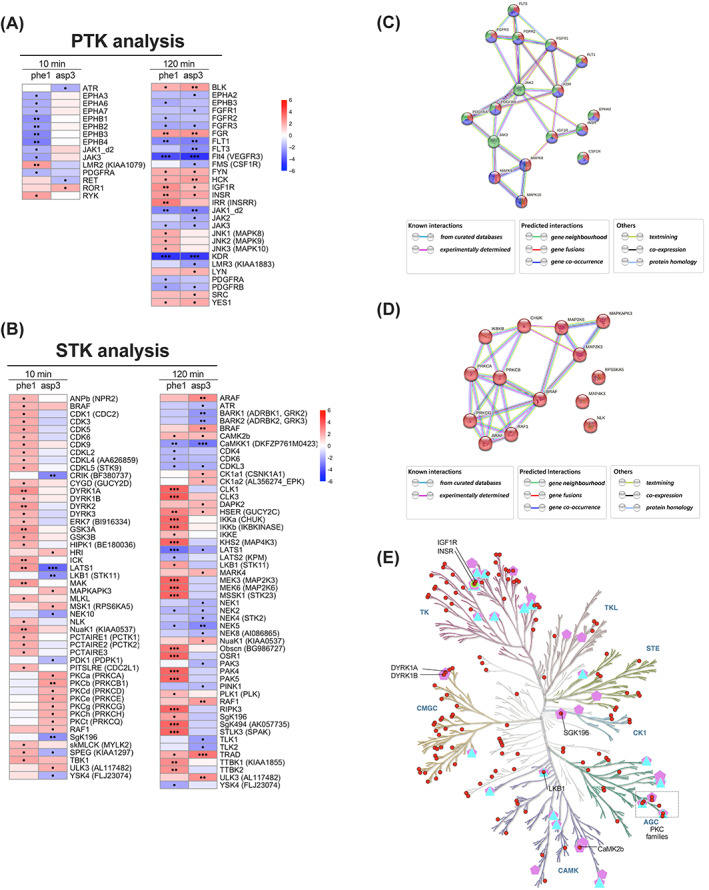
FIGURE 4.

Biased agonist versus exendin‐4 kinase activity profiles. A, Heatmap of recalculated PTK z scores for exendin‐phe1 (phe1) and exendin‐asp3 (asp3), indicating Tyr kinase activity changes versus exendin‐4. B, As for (A) for Ser/Thr kinase activity changes compared with exendin‐4. Positive z scores (shown in red) indicate increased, while negative z scores (shown in blue) indicate decreased kinase activity; •P < .05, ••P < .01, •••P < .001; P values were determined by one‐tail t‐tests. C, Kinase interaction network for Tyr kinases involved in the pathways selected; red: Ras pathway; blue: MAPK pathway; green: PI3K‐Akt pathway; D, Kinase interaction network for Ser/Thr kinases involved in the MAPK signalling pathway. A medium confidence (minimum required interaction score of 0.004) was selected for depicted interactions; filled nodes represent proteins with known or predicted 3D structures, while empty nodes represent proteins of unknown 3D structure; node colours represent distinct pathways. E, Kinase tree map: red circles correspond to kinases shown in (A, B); triangles are kinases related to diabetes mellitus; green circles are kinases related to abnormal glucose homeostasis; pentagons are kinases related to metabolic disease. MAPK, mitogen‐activated protein kinase; PTK, protein tyrosine kinase; STK, serine/threonine kinase
