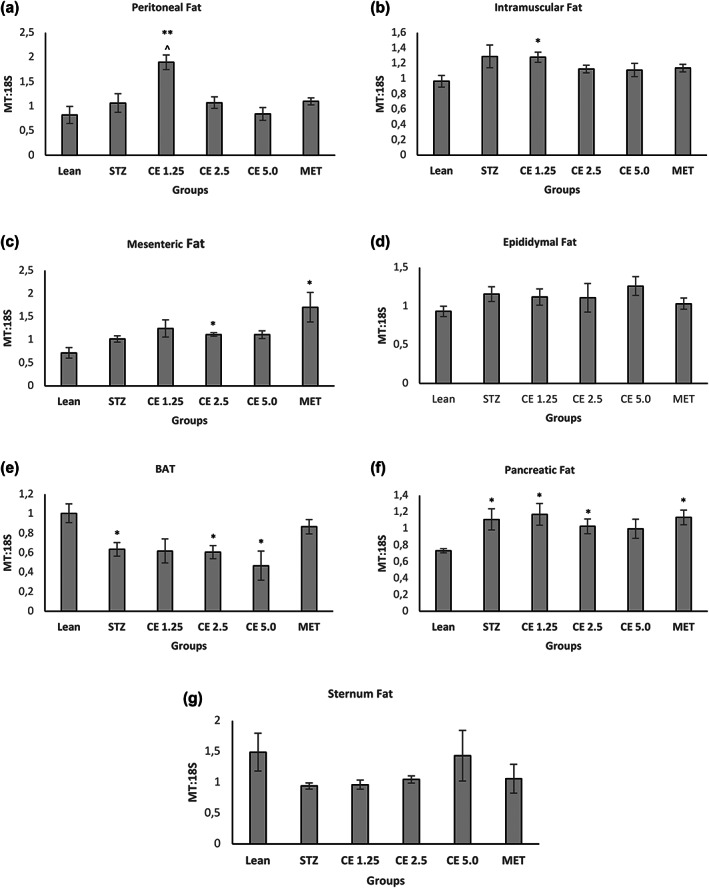
FIGURE 2.

Mitochondrial to Genomic DNA ratio of various fat deposits. Mitochondrial to Genomic DNA ratio was determined across various fat deposits namely (a) Peritoneal, (b) Intramuscular, (c) Mesenteric, (d) Epididymal, (e) BAT, (f) Pancreatic, and (g) Sternum fat. Error bars represent ± standard error of mean (n = 6–7). *p < 0.05, **p < 0.01, ***p < 0.001 relative to Lean and ^p < 0.05 relative to STZ
