
Figure 1.
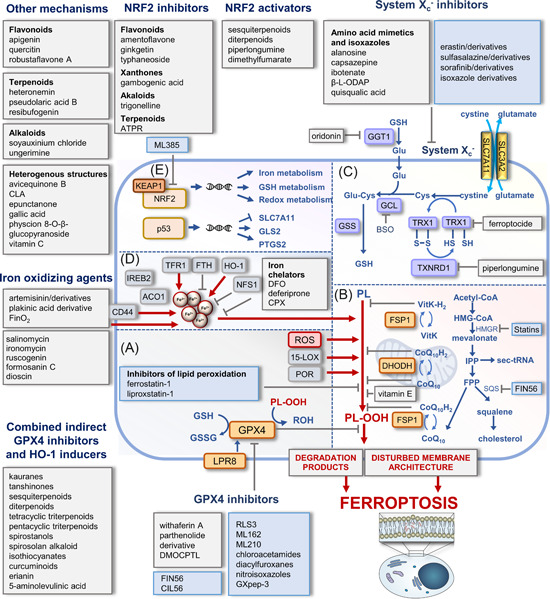
Major metabolic and regulatory pathways in ferroptosis targeted by small molecules. (A) Membrane peroxidation in ferroptosis depends on enzymatic and nonenzymatic mechanisms. LOX isoenzymes and oxidoreductases (POR) with Fe2+/Fe3+ in their active center introduce oxygen into polyunsaturated fatty acids (PUFAs), and free metal ions, in particular Fe2+, convert hydrogen peroxide into hydroxyl radicals via the Fenton reaction. GPX4 reduces lipid hydroperoxides, counteracts ferroptosis, and relies on the biosynthesis and regeneration of its substrate glutathione. (B) Additional protection against membrane peroxidation offers endogenous lipophilic radical traps such as ubiquinol and vitamin K (VitK), which are regenerated by FSP1 and DHODH in the cytosol and mitochondria, respectively. The mevalonate pathway is central for the biosynthesis of (i) cholesterol, (ii) the lipophilic radical trap CoQ10, and (iii) selenocysteine transfer RNA (sec‐tRNA), which inserts selenocysteine into GPX4. (C) System Xc − regulates cellular GSH levels by importing cystine in exchange for glutamate (Glu). Intracellular cystine is reduced to cysteine, which subsequently enters GSH biosynthesis and serves as a cofactor for GPX4. (D) Labile iron levels are kept within narrow thresholds by co‐ordinated regulation of iron uptake via the transferrin receptor and iron storage within ferritin. Other factors in the control of labile iron levels sequester iron into iron–sulfur clusters (NSF1) or liberate iron from heme oxygenase‐1 (HO‐1). The transmembrane glycoprotein CD44 mediates the endocytosis of iron‐bound hyaluronate. The scheme illustrates points of attack of selected small molecules that induce ferroptosis, with a focus on drug candidates, tool compounds, and natural products. The color of the boxes distinguishes between biogenic/bioinspired (gray) and synthesized small molecules (blue). (E) Central ferroptotic genes are under the control of the transcription factors NRF2 and p53. Mitochondrium in (B) was adapted from “Resting Metabolic Activity vs. Stimulated Metabolic Activity,” by BioRender.com (2020). Retrieved from https://app.biorender.com/biorender-templates. 2,2′‐BP, 2,2′‐bipyridine; 5‐ALA, 5‐aminolevulinic acid; ACO1, aconitase 1; ATPR, 4‐amino‐2‐trifluoromethyl‐phenyl retinate; BHT, butylhydroxy toluol; BSO, l ‐buthionine‐S,R‐sulfoximine; CLA conjugated linolenic acids; CPX, ciclopirox; DFO, DHODH, dihydroorotate dehydrogenase; deferoxamine; DMF, dimethyl fumarate; FPP, farnesyl pyrophosphate; FSP1, ferroptosis suppressor protein 1; FTH, ferritin heavy chain; GCL, glutamate cysteine ligase; GGT1, γ‐glutamyl transpeptidase 1; GLS2, glutaminase 2; GPX4, glutathione peroxidase 4; GSH, reduced glutathione; GSS, glutathione synthetase; GSSG, glutathione disulfide; HMG‐CoA, 3‐hydroxy‐3‐methylglutaryl‐coenzyme A; HMGR, 3‐hydroxy‐3‐methylglutaryl‐CoA reductase; IPP, isopentenyl pyrophosphate; IREB2, iron responsive element binding protein 2; KEAP1, kelch‐like ECH‐associated protein 1; LOX, lipoxygenase; NFS1, mitochondrial cysteine desulfurase; NRF2, nuclear factor erythroid 2‐related factor 2; PL, phospholipid; PL‐OOH, phospholipid hydroperoxide; PL‐OH, phospholipid alcohol; POR, cytochrome P450 oxidoreductase; ROS, reactive oxygen species; SQS squalene synthase; TFR, transferrin receptor; TRX, thioredoxin; TXNRD1, thioredoxin reductase 1; β‐ l ‐ODAP, β‐N‐oxalyl‐l‐α‐β‐diaminopropionic acid. [Color figure can be viewed at wileyonlinelibrary.com]