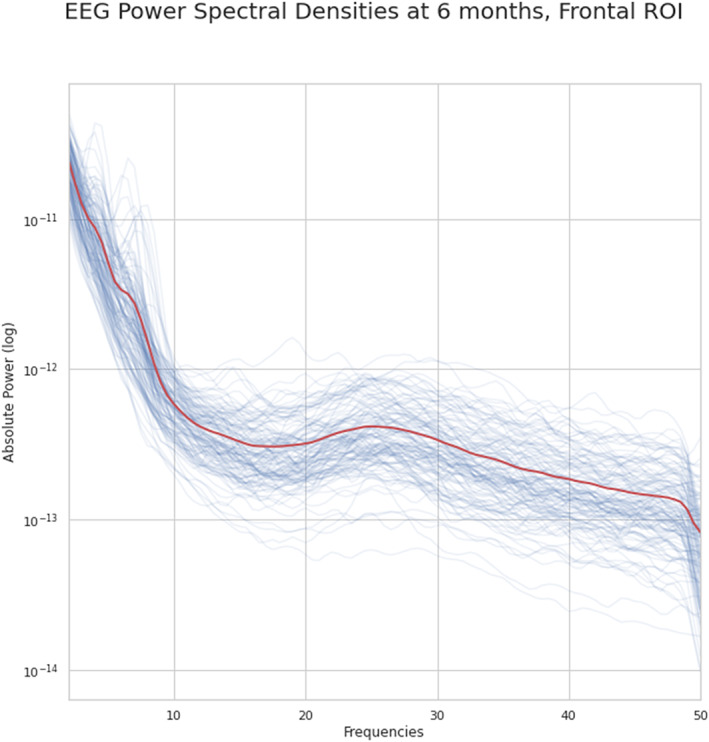
FIGURE 1.

Absolute power spectral densities at 6 months for each EEG recording. Each thin blue line represents spectral power density (averaged across the 3 frontal channels) of an individual recording, while the thick red line represents the average across recordings.
